Source: Surveys of NVSP Participants, Environics Research (1000 respondents for each time period)
Final Report
July 12, 2011
Previous page | Table of Contents | Next page
This section presents the evaluation findings for each issue and the related evaluation questions. At the beginning of each section, a summary of the key findings is presented, with an assessment based on standardized ratings. The ratings and their definitions are outlined in Table 4, and a summary of the ratings for each evaluation question is presented in Annex 4.
Table 4: Ratings and Definitions
Rating
Definition
Achieved
The intended outcome or goal has been achieved or met.
Progress Made; Attention Needed
Considerable progress has been made to meet the intended outcome or goal, but attention is still needed.
Little Progress; Priority for Attention
Little progress has been made to meet the intended outcome or goal, and attention is needed on a priority basis.
Not Applicable
A rating is not applicable.
Overall, the evidence indicates that there was an identified need for the NVSP. Model-year 1995 and older vehicles produce significantly more smog than newer models, and there is scientific evidence that smog is highly toxic for the environment and human health. When the NVSP was developed, there remained about 4.6 million model-year 1995 and older models on the road. There was also a need to promote environmentally safe vehicle recycling practices in Canada.
The program is generally consistent with federal priorities and EC’s mandate and priorities. Although there were regional initiatives with similar objectives when the NVSP was implemented, none were of similar scope. However, EC made efforts to build on these regional efforts in order to reduce duplication.
The evaluation evidence suggests that there is not a significant continued need for the NVSP past March 2011.
Relevance
1. a) Did the Vehicle Scrappage Program respond to an identified need?
What was that need?
Rating: Achieved
b) Is there a continued need for the program?
Rating: Not Applicable
The evaluation examined these related questions using data collected through the document and literature review and the KI interviews.
Findings:
Evidence indicates that there was an identified need for the NVSP. Model-year 1995 and older vehicles produce significantly more smog than newer models, and there is scientific evidence that smog is highly toxic to the environment and human health. When the NVSP was announced in 2007, there remained 4.6 million model-year 1995 and older models on the road. There was also a need to improve the environmental standards of vehicle recycling practices in Canada. However, the evaluation evidence suggests that there is not a significant continued need for the NVSP past March 2011.
a) Did the NVSP respond to an identified need? What was that need?
According to evidence, there was an identified need for the NVSP. In 2007, there were 4.6 million model-year 1995 and older vehicles on the road; these vehicles produce 19 times more smog-forming pollutants than 2004 and newer models (Environment Canada 2007a, p. 2). These pollutants include VOCs, NOx, PM and carbon monoxide. Accelerating removal of these vehicles from the road reduces these emissions. As well, by encouraging the use of sustainable transportation (e.g., public transit, bicycles), the program offers the potential to reduce GHG emissions.
Smog is the noxious mixture of ground-level ozone and PM, and is considered highly toxic to human health. Research indicates that higher levels of smog are associated with increased mortality and morbidity (Health Canada 2000), and increased risk rates for chronic bronchitis, asthmatic attacks and restricted activity days. Overall, these events translate into increased emergency room visits and hospital admissions for respiratory illness and cardiovascular complications. Another Health Canada document (Health Canada 2003) indicates that smog can worsen existing heart and lung problems, especially among seniors who are most at risk. Children can also be more sensitive to the effects of air pollution, because of their lifestyle and the fact that their respiratory systems are still developing.
Smog also has negative environmental impacts, as vegetation health and productivity are harmed by pollutants like ground-level ozone (Environment Canada 2011a). Furthermore, smog can harm wildlife, their habitat, and the availability and quality of their food supply.
Smog-forming emissions from individual vehicles have been greatly reduced through government regulation and the resulting technology improvements in exhaust systems. In Canada, a 1995 or older-model vehicle produces 19 times more smog-forming emissions than a 2004 or newer model.
Replacing an older vehicle with a newer one does not necessarily reduce GHG emissions. Unlike smog-forming pollutants, GHG emissions cannot be reduced drastically through improved exhaust technology; GHGs are reduced by burning less fuel. This can be achieved by reducing personal vehicle usage, driving more fuel-efficient vehicles, or switching to sustainable modes of transportation like public transit and cycling. So, replacing an older vehicle with a newer and larger one will reduce smog emissions but could increase GHG emissions due to higher gas consumption. Thus, because the NVSP did not prescribe the replacement vehicle (or type of transportation), GHG reduction was only a secondary goal of the program.
In addition to reducing the impact of emissions from these older cars, there was a need to improve environmental practices among vehicle recycling companies. Harmful substances such as oil, antifreeze and mercury can be released into the environment if proper recycling measures are not implemented. Although there are municipal, provincial and federal laws that apply to this industry, there was evidence that some vehicle recyclers were not aware of the various acts and bylaws that were applicable to their operations.
The 2007 Budget recognized the value of scrappage programs, by providing funding to support and develop an initiative that removed older vehicles from the road.
b) Is there a continued need for the program?
Although there was a documented need for the program in 2007, there is no longer any documented evidence to support a renewal of the program (with its current parameters) after March 2011, especially considering the natural retirement rate of the vehicles of these model years (see Figure 1 in section 2.1).
EC staff who were interviewed for this evaluation reported that, at program inception, there was a recognized need to accelerate the retirement of older high-polluting passenger vehicles, promote sustainable transportation alternatives through incentives, and promote responsible recycling of retired vehicles through a national code of practice that would improve standards and vehicle disposal practices. The NVSP was seen as supporting the CAA’s clean transportation theme, and as complementing other non-regulatory initiatives previously announced under the ecoTRANSPORT Strategy (e.g., ecoAUTO rebate for fuel-efficient vehicles, the ecoMOBILITY program to help increase transit ridership and alternative transportation, and the ecoENERGY for Personal Vehicles program to encourage Canadians to make better purchasing, driving and vehicle maintenance decisions). A national program was also considered to be a good way of consolidating smaller provincial programs.
A majority of the EC staff reported that there was not a continued need for the program beyond its end date. As of April 2011, the targeted vehicles (model-years 1995 and earlier) were more than 15 years old, near the end of their “natural” lives, and facing retirement through normal attrition. Continuation of the program was not seen as the best use of federal funds, a view confirmed by the number of participants who reported that they would have retired their vehicle irregardless of RYR (a finding presented with the results on the achievement of outcomes in section 4.3).
NFP respondents had a somewhat different perspective: they believed there were still more cars to be retired, particularly in rural areas where take-up of the program had not been extensive. NFPs believed that demand for the program is still high and that consumer readiness to retire their cars is not always in line with the timing of government programs. The provincial representatives also believed that there was a continued need for the program, as there are many model-year 1995 and older vehicles still on the road.
NFPs did not, however, necessarily express the view that a program should continue to exist at the national level, and at least three of the NFPs intend to continue their program at the provincial level just as they had before the national program was implemented. It was also acknowledged that if the program were to be reinstated in the future, there would need to be more emphasis on GHG reductions and more outreach about the importance of environmentally safe vehicle recycling. Education for the public and the vehicle recycling community was seen as being more critical than offering incentives. SI expressed the view that the political landscape is changing with respect to the way that the auto industry deals with older cars. In their view, NFPs and provincial governments would like to see a greater emphasis on product stewardship and manufacturer responsibility.
Need for code of practice. Respondents representing the vehicle recycling organizations believed that there was a continued need for the recycling code of practice. ARC and its provincial affiliates will continue to promote the code, and ARC committed to conducting audits for the next two years without EC funding. Beyond those two years, it is not clear if there will be funding to continue the audits. The Ontario Automotive Recyclers Association has made adherence to the code a condition of membership in the association.
Relevance
2. Did the program complement or duplicate other federal and/or provincial government programs (i.e., Transport Canada programs, provincial emission testing programs, etc.)?
The evaluation examined this question using data collected through the document review and KI interviews.
Rating: Achieved
Findings:
Although there were regional initiatives with similar objectives when the NVSP was implemented, none were of similar scope. However, EC made efforts to reduce duplication by building on these initiatives.
There is no documented evidence of a similar program of national scope, and interview respondents indicated that there were no other federal programs duplicating the NVSP at the regional level. There were, however, a number of programs run by NFPs, such as Car Heaven (national), the Lung Association in New Brunswick and Manitoba, BC Scrap-It, Faites de l’air in Quebec, and the Kidney Car Program (a fundraising initiative of the Kidney Foundation of Canada).
Many of these existing programs had different approaches to the NVSP and/or did not have the same scope. The environment was not always the focus, and the cars did not always get recycled (in some cases they were resold). For example, Car Heaven (undertaken by the Clean Air Foundation / SI) targeted both “live” (functioning) and “dead” (non-functioning) vehicles (“dead” vehicles do not emit smog-forming pollutants). It offered rebates on the purchase of a new vehicle exclusively with one vehicle manufacturer, free towing, and a nominal charitable income tax receipt. Car Heaven retired approximately 8000 live vehicles in 2006 and did not receive federal funding. The Manitoba Lung Association and New Brunswick Lung Association ran programs in their provinces that offered a variety of incentives (e.g., transit passes, vehicle rebates) but no cash reward, and they did receive federal funding. The Kidney Foundation of Canada’s program, which operated in seven provinces, collected mostly dead vehicles and offered free towing and a small income tax receipt (the amount of which varied by geographic area).
Seven of the pre-existing programs received funding from EC, but the scale of these operations was much smaller than the NVSP. For example, in 2006 only 3700 live vehicles were retired through the EC-funded programs. This represented a very small percentage of the estimated 5.5 million model-year 1995 and older vehicles on the road at that time, and there was an expressed need to accelerate the retirement rate of these highly polluting vehicles.
There were also a number of other programs (outside the CAA) that complemented the NVSP, including:
Relevance
3. Was the Vehicle Scrappage Program aligned with departmental and federal government priorities?
The evaluation examined this question using data collected through the document review and KI interviews.
Rating: Achieved
Findings:
The program was generally consistent with federal priorities, and EC’s mandate and priorities, related to air quality and climate change.
Documents indicated that the NVSP was aligned with departmental and federal government priorities. It contributed to the Government of Canada commitment to reduce emissions that contribute to air pollution and climate change, as stated in the Government’s 2007 plan Turning the Corner: An Action Plan to Reduce Greenhouse Gases and Air Pollution, which identified air emission targets for 2020 (from all sources combined). Through its CAA, the Government announced a series of regulatory actions in sectors such as industry, transportation, and consumer and commercial products.
The NVSP is one of the non-regulatory program measures under the clean transportation theme (see box below for a description of the CAA).
Through the CAA, the Government of Canada has been working toward making tangible improvements in Canada's environment by addressing the challenges of climate change and air pollution. Since 2007, the CAA has been supporting regulatory initiatives in the industrial, transportation, and consumer and commercial sectors, and has been supporting a range of complementary measures designed to reduce GHG emissions, improve indoor air quality, mitigate the impacts of climate change, and engage at the international level.
The CAA is managed through a horizontal management, accountability and reporting framework. The 45 programs of the CAA are organized within eight themes: Clean Air Regulatory Agenda, clean energy, clean transportation, indoor air quality, international actions, adaptation, partnerships, and management and accountability. The shared outcomes are as follows:
Source: http://www.tbs-sct.gc.ca/hidb-bdih/initiative-eng.aspx?Hi=12
The NVSP complemented actions announced under the Regulatory Framework for Air Emissions, such as the mandatory fuel-efficiency standard beginning with 2011 model-year vehicles and the proposed notice under the Canadian Environmental Protection Act, 1999 to require the preparation and implementation of pollution prevention plans for mercury released from end-of-life vehicles. It also complemented initiatives under the ecoTRANSPORT Strategy, and was intended to be cross-promoted with other programs designed to encourage emission reductions from transportation (ecoAUTO rebate, ecoENERGY for Personal Vehicles, and ecoMOBILITY).
Relevance
4. Was the Vehicle Scrappage Program consistent with the Department’s mandate and with federal roles and responsibilities?
The evaluation examined this question using data collected through the document review and KI interviews.
Rating: Achieved
Findings:
The NVSP was aligned with EC’s strategic outcome related to pollution minimization, and was consistent with departmental and federal roles and responsibilities.
The NVSP was aligned with EC’s strategic outcome “Threats to Canadians and their environment from pollution are minimized” under sub-sub-activity 3.2.2 “Climate Change and Clean Air Partnerships” in EC’s Program Activity Architecture. EC staff indicated that the NVSP was consistent with the Department’s mandate and its federal roles and responsibilities. It complemented actions announced under the Regulatory Framework for Air Emissions, such as the mandatory vehicle fuel-efficiency standard and implementation of pollution prevention plans for mercury released from end-of-life vehicles. The program responded directly to key government priorities and Canadian concerns about air quality.
The federal government was seen as being uniquely positioned to fund national programs of the scope required by the NVSP. Federal support allowed for a national approach that was more effective than individual vehicle scrappage programs implemented locally at the provincial or regional level (as was the case before the launch of the NVSP).
Evidence indicates that the program objectives were well defined up front, including precise overall program targets (such as 200 000 vehicles retired over four years). However, these four-year targets became unattainable because the full national program was not launched until January 2009. Annual targets (such as 50 000 vehicles per year) were met or exceeded once full implementation was achieved. The objectives for the recycling code of practice were realistic, well defined, and successfully achieved.
One of the key design features of the program was the use of a contribution agreement with a national NFP to administer the program, and the use of a network of provincial NFP partners to deliver the program. These features were shown to be effective and efficient overall. The advantages included faster implementation, flexibility, and reduced duplication with other programs in other jurisdictions. As a result of this delivery approach, participant satisfaction with program administration and the incentives was high during the program’s early stages, and increased to a very high level as the program matured.
Evidence indicates that the program achievements were captured effectively and efficiently through an online data system, comprehensive surveys, and ongoing tracking of vehicle recycler audits. A wide range of communications activities undertaken to communicate program performance and the achievements of the program were successful at reaching key stakeholders and the general public.
Comprehensive program performance data were collected through the SPARC system, quarterly and annual reports, surveys, and various program management tools such as spreadsheets to monitor vehicle recycler audits.
Key lessons learned included: the effectiveness of using an NFP for program delivery; the need for hands-on involvement by EC in managing a large, complex contribution agreement; the need to allow adequate time to reach full implementation of a complex program of this size and scope and involving many partners; and the importance of clearly defined roles, responsibilities and lines of communication.
Performance – Design and Delivery
5. Were the objectives of the program realistic and adequately defined?
The evaluation examined this question using data collected through the document and literature review and KI interviews.
Rating: Progress Made; Attention Needed
Findings:
Program objectives were well defined. However, the four-year program target of retiring 200 000 vehicles overall became unattainable because the full national program was not launched until January 2009, 21 months later than initially expected. Annual targets (50 000 vehicles per year) were met or exceeded once full implementation was achieved. The objectives for the recycling code of practice were realistic, well defined and successfully achieved.
As presented in section 2 of this report, the program’s objectives were clearly defined in program documentation. According to documentation, the NVSP’s primary goal was to reduce air pollutants by removing older, high-polluting personal vehicles from the road. Secondary goals were to reduce GHG emissions by promoting low-emission alternative transportation to prevent the release of toxic substances into the environment (Environment Canada 2008, p. 4). As presented earlier in this report, the program had developed a logic model, and specific targets (e.g., removal of 50 000 vehicles per year).
EC staff agreed that the program’s objectives were clear and that the annual target of scrapping 50 000 cars per year was reasonable for the program once it was fully operational. In fact, this target was exceeded for 2009–2010 and 2010–2011. The original four-year target of retiring 200 000 vehicles over the life of the program was not attainable because RYR was fully operational for only 27 months, not 48. It took close to one year to receive policy and funding approval, and almost another year to develop and launch the program and to achieve full implementation.
Overall, NFPs thought that the objectives of the program were realistic and well defined, and that there were good linkages between the objectives, activities and outcomes set for the program. One NFP described the program targets as “ambitious” and noted that setting high targets “was the right thing to do” because they were achieved and exceeded.
Similarly, provincial government representatives thought that the program objectives were realistic, and agreed that there are strong linkages between RYR program objectives and activities. One provincial government representative attributed the good linkages between program objectives and activities to the pre-existing programs that provided a good basis from which to develop RYR targets. Another thought that the pollution reduction targets could have been more aggressive.
Vehicle recycling code of practice. The development and implementation of a national recycling code of practice was a realistic and practical fit with the program objective of recycling vehicles using environmentally safe practices. Prior to the launch of the NVSP, ARC had been interested in developing a national code of environmental practices and had approached the Car Heaven program to discuss the opportunities for a national code. The auto recycling industry already had a code of practice in place in B.C. and a set of best practices in Quebec. Industry representatives also were aware of similar work being carried out in the United States. This previous work provided a solid platform for ARC, EC and other stakeholders to work on the development of a new recycling code of practice. The EC-funded contracts with ARC greatly accelerated and expanded the process of developing and implementing the recycling code of practice nationwide.
All KIs reported that the development and implementation of the recycling code of practice represented a large and successful step toward achieving the objective of using environmentally sound practices to recycle cars. The program required all participating auto recyclers to comply with the code, which was verified by independent audits. Some 350 of the approximately 370 auto recyclers who participated were audited through the program, and of those 350, 92% passed their audits. The reasons that not all recyclers could be audited were a higher participation by recyclers than anticipated and a delay in awarding the contract to conduct the audits.
Performance – Design and Delivery
6. a) Was the design of the Vehicle Scrappage Program appropriate for achieving expected program results?
b) Was the funding of the program commensurate with its objectives and the needs identified?
The evaluation examined these related questions using data collected through the document and literature review, KI interviews and case studies.
Rating: Achieved
Findings:
Key design features were as follows: EC funding through a contribution agreement with a national NFP to administer the program, and use of a network of provincial NFP partners to deliver the program. These features were proven to be effective and efficient overall. The advantages included faster implementation, flexibility when making adjustments, and reduced duplication. Program funding for cash incentives and program operations was adequate.
a) Was the design of the Vehicle Scrappage Program appropriate for achieving expected program results?
Overall, EC and other key partners and stakeholders believe that the design of the program was appropriate for achieving the expected results.
At the program’s outset, EC established linkages between key features of the program design and expected outcomes, shown in Table 5.
Table 5: Linkages Between Program Objectives and Activities
Program Outcomes/Targets
Program Activities
Scrappage of 50 000 in-use vehicles per year of operation
Accelerating the retirement of model-year 1995 and older vehicles is the main program activity.
Annual reduction of smog-forming emissions: approximately 2250 tonnes of NOx and VOCs, and 54 000 tonnes of GHGs
A calculation methodology was developed to estimate impact on emissions from the retirement of an older vehicle and its replacement.
A reduction of GHG emissions through increased use of sustainable transportation
Incentives related to sustainable transportation were promoted.
An increase in awareness and understanding among Canadians of the environmental impacts of older vehicles
SI, provincial NFPs and EC undertook outreach and promotion activities.
A reduction in the release of toxic substances
Development of a vehicle recycling code of practice that will lead to higher standards nationally and that may be adopted by provinces and territories
Implementation and use of a recycling code of practice is a key element of the program.
A 3:1 leveraging of federal funding by partners for incentives
Offering attractive incentives is a key element of the program.
Source: NVSP Accountability, Risk and Audit Framework, 2008
One of the program’s key features was the involvement of one national NFP and eight provincial NFPs to deliver the NVSP. There was widespread agreement among KIs that successful implementation would not have been possible without partner contributions, including NFPs and provincial government support. In fact, delivery of the program involved many partners that played key roles in its success:
EC representatives believe that the program’s successes have proven that its design and approach, especially the contribution to SI, were appropriate. From EC’s perspective, working with a national-level NFP made it easier because of the single point of contact for the NFP network, and working under a contribution agreement provided flexibility for SI to conduct program operations. The contribution to a single national organization also allowed EC to leverage the expertise and resources of an organization with experience in the area. The other key aspect was the involvement of the provincial NFP network, which leveraged local resources and knowledge while reducing potential duplication.
According to interviews, the governance structure, which involved hands-on management by EC, was highly effective. A departmental representative commented that “this is not a hands-off process.”
SI representatives strongly agreed that using a network of partners is a good way to set up this type of program. From their perspective, the challenge of operating a national program was accommodating provincial programs and allowing the different programs to operate in different ways (e.g., with different databases). Provincial NFPs also strongly agreed that it was beneficial to have local participation in each province instead of the program being conducted solely by a national organization. EC provided overall program direction and policy advice, while promoting the program through the departmental website and news releases (which helped give the program a national presence). SI provided national leadership and coordination. The advantage of having provincially based organizations was that they could address the differences in each province and adapt to provincial needs. Pre-existing programs meant that provincial NFPs had already established relationships with auto recyclers and incentive providers as well as a public profile. These NFPs also had experience with program promotion and advertising.
ARC reported that the design and planning involved in developing the recycling code of practice was effective. The project depended on partnerships between ARC and its provincial affiliates, SI, EC (which funded two contracts with ARC related to code of practice development and implementation), and auto recycling companies.
Roles and responsibilities. Two operational assessments were conducted for SI during the program: one overall by CBW Associates, and one by the Taylor Research Group for the call centre, in 2010. According to the CBW study, the roles, responsibilities and expectations were not clearly defined. According to the call centre assessment, the responsibilities of the call centres (and who gives them direction) were neither clear nor consistently understood. Some people were not clear on whom to interface with at SI to obtain help or resolve issues, and thus they were not confident that their issues were being addressed. According to the reports, NFPs wanted to be consulted more extensively (e.g., on national incentives), and communicated with in advance rather than after decisions had been made.
From a provincial perspective, some NFPs thought that SI, during the initial stages of the program, was not flexible enough in adapting to their existing operations and that the roles and responsibilities were not clear. They said that some staff turnover at SI added to the problem.
Other issues pertaining to roles and responsibilities as well as communications arose from EC having had previous relationships with NFPs. EC had relationships with some of the provincial NFPs before SI became involved with the introduction of RYR, which created some communications problems for people who were used to dealing with EC directly instead of following the RYR reporting relationships and communicating with SI. The mid-program review by CBW helped identify this problem, and the provincial NFPs were given clear instructions to communicate with SI about any administrative, procedural or contractual issues.
There were also communications problems that resulted from the reporting relationships between SI and NFPs that contracted with external call centres (i.e., in Ontario, Saskatchewan and the Atlantic provinces). SI introduced monthly conference calls with the call centres and NFPs to deal with processing issues and complaints.
The mid-program review identified some of these above issues, and steps were taken by EC and SI to address them. Most NFPs agreed that the actions taken following the review were effective at addressing problems that occurred during the initial stages of the program. These actions included the following:
Incentives. Some NFPs expressed concerns about the impacts of certain incentives on the GHG reduction goal (which was more important to some NFPs than was stated in the program design). Their concern was that rebates on the purchase of a new vehicle led to higher GHG emissions, as most manufacturers provided higher incentives for purchasing larger vehicles (e.g., larger cars and light trucks).
Reach. The program was implemented in all regions except in the three territories. EC had wanted to launch a pilot project in the north and asked SI to develop a plan, but SI determined that it would be too difficult due to the absence of a suitable NFP network to administer the project, a lack of auto recyclers, and a limited number of auto dealerships or outlets to enable provision of incentives to more remote areas. Therefore, a decision was made to not proceed with a pilot project.
b) Was the funding of the program commensurate with its objectives and the needs identified?
According to interview findings, program funding through the contribution agreement between EC and SI was sufficient to deliver the program. As part of the program design, a broad objective was set to split the overall spending under the contribution agreement, with a maximum of 25% to cover operating costs and the remaining funding to be allocated to incentives. By program end, the cost split was 30% and 70%, respectively. SI’s increased operating costs were attributed to the extra advertising that it delivered. This additional program promotion was a partial replacement for advertising cancelled by EC.
EC’s O&M budget was sufficient for the cost of typical expenses for EC staff (e.g., telecommunications, office supplies, training), to support EC monitoring activities such as audits of vehicle recyclers for adherence to the recycling code of practice, a recipient audit of the contribution agreement between EC and SI, vehicle data, some travel, and program evaluation.
The funding agreements between EC and SI and between SI and provincial NFPs required the establishment of separate bank accounts for funds allocated to incentives and for program delivery costs. This requirement allowed for close monitoring of program funds and was particularly useful for managing operating costs. EC also provided funding directly to local NFPs for program delivery on an interim basis between April 1, 2008, and December 31, 2008, until SI’s exclusive arrangement with an auto manufacturer ended.
Overall, NFPs reported that funding for the program was sufficient to achieve its objectives. One provincial NFP described the program as “one of the cheapest programs to run.” Some NFPs, however, reported that the amount of work to run the program was greater than what they expected at the beginning. Some reported that the implications of requests by SI and EC requirements were not fully understood, with the result being increased costs for the NFPs. One provincial NFP reported that it “struggled on the operational side,” particularly with human resources and covering the costs of staff time. Another reported that management of the program was more demanding than expected.
Amounts for incentives. Initial budget targets for incentives were based on the population of the province or on the estimated number of older vehicles in the province. Allocation of operational funds was proportional to the number of vehicles to retire. Two NFPs said that the budgeting formula did not work as well for their organizations because they operated in smaller provinces. They reported that the amount of funding did not allow them to achieve their provincial targets for vehicles recycled.
Advertising. Despite the decision by EC to not invest in a national advertising campaign, EC and SI believe that the advertising and promotion activities conducted by SI and local NFP partners, along with media coverage, were sufficient to generate broad public awareness of RYR.
Performance: Design and Delivery
7. a) Were participants satisfied with the administration of the program by both the Department and the not-for-profit organizations?
b) Were participants satisfied with the incentives provided to reward them for scrapping their vehicle (type and value)?
The evaluation examined these related questions using data collected through participant surveys and case studies.
Rating: Achieved
Findings:
Participant satisfaction with program administration and the incentives was high during the program’s early stages, and increased to a very high level as the program matured.
a) Were participants satisfied with the administration of the program by both the Department and the not-for-profit organizations?
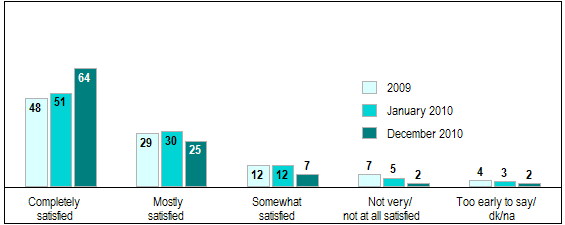
Participant satisfaction was monitored through various means, including surveys of program participants. According to the survey reports, satisfaction with the NVSP steadily increased over the program lifespan. Overall satisfaction (the proportion of respondents completely and mostly satisfied) rose from 77% in 2009 to 89% in December 2010 (see Figure 4).
Figure 4: Level of Program Participants’ Satisfaction with the NVSP
Source: Surveys of NVSP Participants, Environics Research (1000 respondents for each time period)
As indicated in the survey responses in Figure 5, the level of satisfaction with call centre staffs’ ability to answer questions, their level of knowledge, and their capacity to provide bilingual services generally increased between 2009 and December 2010.
Figure 5: NVSP Participants’ Views on Program Delivery at Call Centres
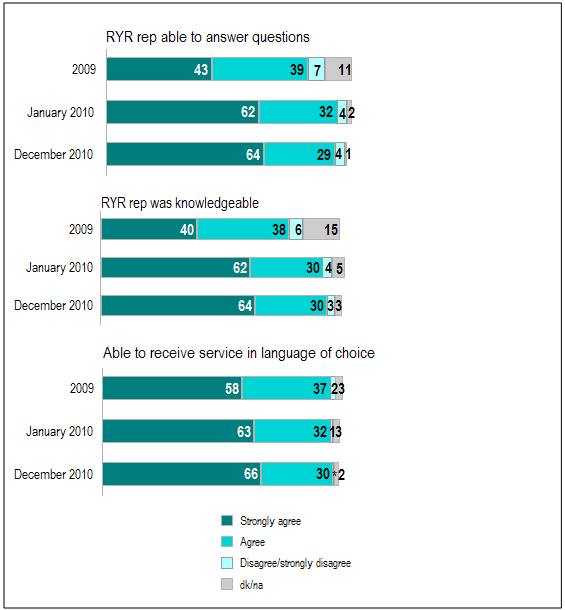
Source: Surveys of NVSP Participants, Environics Research (1000 respondents for each time period)
* Less than 1% for “disagree/strongly disagree”
As illustrated in Figure 6, the proportion of participants who agreed or strongly agreed that vehicles were picked up in a timely fashion and that incentives were received in a timely fashion also increased as the program matured.
Figure 6: NVSP Participants’ Views on Timeliness of Vehicle Pickup and Receipt of Incentives
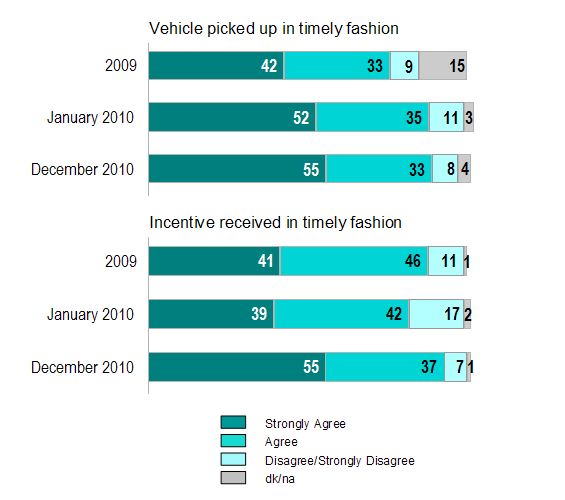
Source: Surveys of NVSP Participants, Environics Research (1000 respondents for each time period)
Overall, these findings indicate that the level of satisfaction increased as the program matured. The increase in participant satisfaction coincided with the program’s efforts to address initial operational issues, uncovered by the mid-program review.
Vehicle recyclers. For ARC, the two contracts with EC made it possible for them to develop the code of practice, and train and deploy auditors of vehicle recyclers across the country. A third contract with SI allowed ARC to design and deliver training for the code. ARC was satisfied with how the contracts were administered by EC and SI.
Auto recycling companies were satisfied with the program’s administration, including the process to receive vehicles. One company reported that some minor “administrative glitches” at the program’s beginning were resolved once the online system was implemented, stating that “There were no issues at the end.”
Auto recycling companies also indicated that they found the recycling audit process fair and that it helped them to improve their businesses.
b) Were participants satisfied with the incentives provided to reward them for scrapping their vehicle (type and value)?
Although the incentives package varied among regions, all participants could choose the $300 cash incentive, and many had access to other forms of incentives such as public transit passes or discounts on new bicycles. Most participants opted for the cash incentive, according to program data. The number of participants who opted for the cash incentive rose through the life of the program (from 66% in 2009 to 85% in December 2010). Satisfaction with the incentives among the participants surveyed (i.e., those indicating very satisfied or somewhat satisfied) was 94% in December 2010. Four in ten participants received a new vehicle manufacturer’s rebate or discount in 2010, and were more likely (64%) than those who did not receive a rebate or discount (57%) to be “very satisfied” with the value of their incentive.
Performance – Design and Delivery
8. Were the achievements of the Vehicle Scrappage Program effectively and efficiently captured and disseminated (disseminated to appropriate audiences, i.e., key stakeholders and the general public)?
The evaluation examined this question using data from multiple sources, including the document review, KI interviews and case studies.
Rating: Achieved
Findings:
Program achievements were captured effectively and efficiently through in-depth monitoring of real-time transactions and program performance with the SPARC system, comprehensive surveys of participant satisfaction and public awareness, and ongoing tracking of vehicle recycler audits. A wide range of communications activities undertaken to communicate program performance and achievements were successful at reaching key stakeholders and the general public. These activities included workshops, webinars and conference calls among the NFP network, providing all partners with access to the SPARC system, presenting results such as the Clunker Counter on the RYR website, and press releases from EC and NFPs.
SI and EC undertook a number of initiatives to effectively and efficiently capture and disseminate achievements:
According to interviews, communications to stakeholders about program achievements were extensive. EC presented program data at workshops and by email to the NFPs, including, for example, data on the number of vehicle rebates chosen, projected program participation, and recycler audit results. SI also provided NFPs with monthly reports on the numbers of applications accepted, vehicles permanently retired and other indicators. SI hosted semi-annual workshops with NFPs, held regular conference calls, and communicated by email and telephone with NFPs to disseminate program information.
Communications to the general public about the program and program achievements took place in a variety of ways:
NFPs expressed favourable opinions about the dissemination of information overall. The website was characterized as “very good” and the marketing as “good,” and one NFP described the information sharing as “fantastic.” Public survey data on how people were learning about the program (e.g., by ads, word of mouth or websites) helped some provincial NFPs develop marketing strategies.
It was noted, however, that the NFPs would have preferred more credit being given to the provincial providers in SI’s national marketing initiatives. Some NFPs indicated that they would have liked more sharing of best practices with other provinces so that provinces would know what was taking place nationally.
Some NFPs also indicated that they would have benefited from more timely receipt of information about “some of the broader issues,” such as how the vehicle manufacturers' incentives affected the program and how potential participants were learning about the program. These NFPs believed that they may have been able to adapt their marketing initiatives more quickly with more timely information.
Performance – Design and Delivery
9. Have appropriate performance data been collected, captured and safeguarded? If so, has this information been used to inform senior management / decision makers?
The evaluation examined this question using data from multiple sources, including the document review, a review of program performance data, and KI interviews.
Rating: Achieved
Findings:
Comprehensive program performance data were collected through the SPARC system, quarterly and annual reports from SI to EC, a mid-program review, participant and general public surveys, and various program management tools such as spreadsheets to monitor vehicle recycler audits. The program monitoring and performance data were used extensively by program managers to direct and fine-tune the program. The value of the monitoring and performance data and the effectiveness of EC managers’ use of these data were demonstrated by the significant increases in program performance and participant satisfaction as the program progressed.
Two public opinion surveys of the general public were conducted to assess awareness of the NVSP, and three surveys of program participants were conducted to assess program delivery and results. This allowed the program to monitor the awareness campaigns as well as program delivery and results.
Financial monitoring was conducted in accordance with the contribution agreement. In the program’s early stages, EC had concerns about SI’s capacity to monitor and report the financial performance of its activities, which SI eventually acknowledged, and for which SI then developed capacity. SI had concerns about some of the provincial NFPs’ capacity to report financial results and use SPARC: SI reported that provincial NFPs initially did not understand the financial complexity of a program of this type and size, and SI believed that they needed to strengthen their human resources and financial management capacity. After substantial efforts by SI and EC, SI and the NFPs made significant improvements in meeting contractual deadlines and deliverables.
Financial monitoring for a program of this size and complexity requires appropriate resources and expertise. Although problems with expense monitoring issues noted during the financial audit were largely corrected, projecting participation remained problematic, and in March 2011 the program was uncertain that the allocated funding would be sufficient. The funding turned out to be sufficient, but SI and EC had to develop contingency plans.
All partners and stakeholders agreed that EC was effective at program monitoring. There was a consensus that EC program staff were diligent and effective at working with NFPs, and other partners such as the automotive recycling industry, to ensure that the program remained on track and that the results were being achieved. One provincial NFP described the monitoring procedures as “much more stringent than any other program we’ve been involved with.”
Overall, EC project monitoring was more intensive than for other typical contribution agreements, because of the program’s complexity, the amount of funding, and the risks associated with delivery by an NFP that did not have previous experience in a project of this scope and size. According to interviews with EC staff, EC monitoring activities included the following:
SI also monitored program activities:
Monitoring was used for decision-making purposes. For example: EC monitored the value of scrapped steel to ensure that recyclers were paying fair prices for cars picked up through the program; data on call centre volumes helped determine the amount to charge NFPs for services provided by the overflow call centre; and the assessment studies conducted by CBW Associates and the Taylor Research Group led to significant operational changes, such as a review of roles and responsibilities, development of standard operational procedures, and the opening of a national call centre to handle overflow.
The results of the recycling audits were summarized on an ongoing basis in spreadsheet files. These results, which were aggregated periodically by EC, confirmed to the Department that auto recyclers were adhering to the recycling code of practice in the great majority of cases. Close to 400 recycler audits were conducted.
The case study of communications found that multiple ads were placed on local radio stations, local and national websites, and in various written publications across the country. According to an RYR Media Coverage Report (November 2010), there were 24 million media impressions1 from the “Spring Cleaning” campaign.
Performance – Design and Delivery
10. a) What are the lessons learned (both strengths and weaknesses) from the program?
b) Are there follow-up activities or programs that could build on the success achieved by this program?
The evaluation examined these related questions using data collected through the document review, KI interviews and case studies.
Rating: Not Applicable
Findings:
Many lessons were learned about program design and planning, implementation and delivery, and ways to increase effectiveness. Key lessons included validation that the use of an NFP organization can be an effective approach for program delivery; the need for hands-on involvement by EC in third-party delivery arrangements; the need to allow adequate time to reach full implementation of a complex program involving many partners; and the importance of clearly defined roles, responsibilities and lines of communication. Follow-up activities that could build on the program’s success include support to continue the legacy of the vehicle recycling code of practice.
a) What are the lessons learned (both strengths and weaknesses) from the program?
Delivery model. The delivery model of one national NFP and local delivery partners worked very well. The use of a contribution agreement instead of a contract (or set of contracts with NFPs) allowed for flexibility in program operations, and meant that SI could be responsive to partners and participants while still having oversight from EC.
The provincial NFPs added credibility and were better able to build regionally specific partnerships. NFPs described this program model as “the way for the non-profit sector and government to work together.” To improve the implementation of this delivery model, SI recommended developing a process map at the beginning to give all partners a clear understanding of their roles and responsibilities from the outset.
For the delivery model to be successful, there was a need for personnel training across the NFP network, ensuring capacity for financial management, and service delivery in both official languages. Program managers reported they now have a much better understanding of the skill set required by NFPs to deliver national programs and that there should be a “checklist” of these requirements in future contribution agreements with NFPs.
A call centre to handle overflow. An overflow call centre was established to provide more consistent and responsive customer service (by substantially reducing the need for voice mail), and improve services in both official languages across the country. This was a very successful initiative, and SI recommended that a national call centre be used in any future programs of this type.
Variety of incentives. The number and variety of incentive partners helped to create higher-value incentives for participants. Provincial government involvement especially helped support sustainable transportation initiatives and made these more attractive to program participants. The cash incentive was also attractive to many participants, possibly because it was the only incentive available to everyone regardless of whether they were rural or urban, or whether or not they were transit riders.
Some NFPs found it difficult to understand the administrative procedures of large potential incentive-provider organizations (e.g., the Toronto Transit Commission).
Importance of service standards. Service standards are very important, both to participants and partners. Clear service standards (e.g., for processing times, car pickup, payments) were introduced and communicated in August 2010 following the mid-program review. KIs agreed that it would have helped to have service standards established at the outset, even if the standards evolved over time.
Need to allow time for start-up and transition to full implementation. KIs agreed that setting up and implementing a national program needs a longer lead time than was originally anticipated. EC and SI signed the contribution agreement in March/April 2008, and envisioned that everything would be in place by June 2008. For SI, the provincial NFP partner negotiations took longer than expected, and their exclusive arrangement with an auto manufacturer under the Car Heaven program until December 2008 also created delays in launching the program. This meant that an interim approach was adopted for the fall of 2008, where EC worked directly with six provincial NFPs.
EC managers believe that implementing a program like the NVSP takes approximately 18 months, which includes time to complete the TB Submission. This means that a program with 48 months of funding will have approximately 30 months of full program activity. This delay was not accounted for when program targets were set (50 000 retired vehicles per year for four years).
Ongoing monitoring. The program implemented effective monitoring tools that allowed timely improvement of the program, such as the mid-program review, which led to the introduction of a national call centre; the financial audit of SI, which led to greater financial accountability; and participant surveys, which led to service improvements. The use of an online database (SPARC) allowed real-time and accurate monitoring of program results.
SI also introduced regular and frequent communications with the NFP network to deal with problems and conflicts that emerged. For example, hosting NFP partnership workshops was, according to SI’s 2010 annual report, an effective way to discuss key issues and build rapport within the team.
Exit strategy. The Treasury Board Secretariat’s requirement for an exit strategy led to a proactive program wind-down. Some funding was transferred to 2011-2012 to support program wind-down when it was understood that the program could not end and wrap up completely by March 31, 2011. The 2011-2012 funding will be used to disperse final cheques to participants, create final reports from NFPs and SI, and ensure all vehicles are picked up. EC and SI described the planning for the exit strategy, which was in place from the start, as very valuable.
Marketing and promotion by NFPs. The marketing and advertising guidelines created by EC’s Communications Branch gave NFPs the flexibility to develop advertising and promotion without ongoing oversight by EC. KIs indicated that many of the advertisements and communication materials from provincial/regional NFPs were very strong, and that their local-level outreach and public relations have been effective at promoting the program and raising awareness. KIs said that it would have been useful if there had been some mechanism or forum for sharing advertisements and promotional materials across the NFP network.
Communications. The NVSP involved many stakeholders at different levels. A number of lessons were learned with respect to communications among these stakeholders, including the following:
b) Are there follow-up activities or programs that could build on the success achieved by this program?
SI and its network of local delivery organizations were given the option to continue delivering the National Vehicle Scrappage Program after April 1, 2011, without federal funding. To date, SI has announced its intention to restart its Car Heaven national program (which they regard as an SI legacy program), and delivery organizations in British Columbia and Quebec will run provincial programs, likely with support from their provincial governments.
Continuing the legacy of the vehicle recycling code of practice. All KIs consider the recycling code of practice to be an important and valuable legacy of the NVSP, and would like it to continue.
In 2011-2012, SI will continue working with the code of practice, by promoting the code to recyclers across Canada and informing Canadians of the environmental and health benefits of selecting a code-of-practice-approved recycler. They will also be investigating means of expanding the code to other complementary industries (e.g., steel recyclers).
ARC will continue supporting the code of practice after the program ends. ARC would like to increase the pass threshold for the code over time as the industry becomes more familiar with the code and as auto recyclers’ environmental practices improve. ARC has also committed to conducting recycling audits for 18 months in Ontario. As well, audits are expected to continue in Alberta and the Atlantic provinces. ARC believes that the developmental stage is complete, having stated that “90% of the heavy work has been done,” and now the priority is to engage in continuous improvement of the code. ARC stated that “continuity is key to have growth in the code of practice.”
For the longer-term viability of the code of practice, ARC stated that it needs a commitment from all partners, including EC, to keep improving the code and make it a continuing success. ARC stated that the work of recruiting and hiring the auditors of vehicle recyclers on a continuous basis will be a challenge, and that they are not sure how this will happen or how it will be financed. ARC recommended setting up an advisory board with representatives of ARC, SI and EC, to upgrade the code of practice on an ongoing basis.
In ARC’s opinion, the Government of Canada (specifically EC) should be involved in two ways: 1) on a standards committee (which would have a low cost and would need no financial support); and 2) on an investigative committee to direct the audits (which would need financial support).
Provincial NFPs agreed that continued support for the vehicle recycling code of practice and for the audits would be helpful in ensuring that the momentum from the good work carried out to date is sustained.
Auto manufacturer rebate programs. ARC believes that there are opportunities for ARC, SI and EC to become involved in auto manufacturer rebate programs that provide incentives for fuel-efficient vehicles.
The NVSP achieved its intended short-term outcomes. The program was made available across all regions, except in the territories due to a lack of recycling infrastructure and low demand. In terms of program awareness among the public, survey evidence indicates that the level of awareness increased steadily as the program matured. The recycling code of practice is considered an important and valuable legacy of the program.
According to program data, approximately 138 600 vehicles were retired through the program. Evidence indicates, however, that some of these would have been retired in the absence of the program. As the NVSP was not fully implemented nationally until 21 months after program inception, it was unable to reach its initial target (200 000 vehicles over four years).
Most of the program’s users preferred the cash incentive and replaced their vehicles with another one. The structure of the manufacturer rebates (which were beyond the program’s control) affected the type of replacement vehicle purchased.
Environmentally safe vehicle recycling practices during the program were ensured by requiring all participating recyclers to adhere to the code of practice. ARC reported that 99% of the participating recyclers plan to continue applying the code of practice after the program ends.
With respect to long-term outcomes, based on EC data the program led to approximately a 5000-tonne reduction in NOx and VOCs emissions, and a 37 500-tonne reduction in GHG emissions.
Many external factors had an impact on the NVSP’s success, including the existence of previous programs, the influence of a scrappage program in the United States (which increased take-up through major awareness campaigns that reached Canadians), the auto manufacturer rebates, and the state of the economy (recession).
As for the unintended benefits, the program helped build NFP capacity, and the positive effects of the recycling code of practice on other stakeholders (steel producers) were beyond expectations. The program also had economic benefits in the context of the recession (by supporting demand for new car purchases), and safety benefits by removing older, less safe vehicles and replacing them with new safer vehicles.
Performance – Effectiveness
11. To what extent have the intended outcomes been achieved as a result of the Vehicle Scrappage Program?
Short-term outcomes:
a) Canadians in all provinces have access to incentives to reward them for removing older vehicles from the road
b) Increased awareness by the public of the program and the environmental impact of older vehicles
c) Increased awareness by recyclers of environmentally safe recycling practices
The evaluation examined this question using KI interviews, a review of documentation and performance data, and case studies.
Rating: Achieved
Findings:
The program was made available across all regions, except in the territories due to a lack of recycling infrastructure and low demand. Regarding program awareness by the public, survey evidence indicates that the level of awareness increased steadily as the program matured. Many program users recognize that their older vehicles are less environmentally friendly than new models, but also believe that car maintenance is a key determinant of the level of pollution produced by automobiles.
The vehicle recycling code of practice is considered an important and valuable legacy of the program. The code was published in print and electronic formats, and was widely and readily available to auto recyclers across the country. The positive impact of the code on auto recyclers’ awareness of environmentally safe recycling practices was one of the program’s successes.
a) Canadians in all provinces have access to incentives to reward them for removing older vehicles from the road
According to documentation and KI interviews, the program was made available in all Canadian regions except the territories. A feasibility study of launching RYR in the territories revealed that the existing program would not be practical, as the territories did not have recycling infrastructure, and derelict vehicles presented a much larger issue than retiring older, live cars.
EC managers and NFPs indicated some difficulties with access and participation for people living in rural or remote areas who may not have access to high-speed Internet or nearby auto recyclers. Despite the vehicle recovery fee that was implemented to subsidize pickup in remote areas, an NFP in a smaller province still identified problems arranging pickup throughout the province when the distance to the nearest auto recycler could be up to several hundred kilometres.
b) Increased awareness by the public of the program and the environmental impact of older vehicles
Advertising and outreach campaigns were conducted to raise awareness about the program and encourage participation. EC had initially planned to spend about $5 million on a national advertising campaign to increase public awareness of the pollution caused by older vehicles, but the campaign was cancelled and only ad concepts were created. However, EC and SI believe that local advertising and promotion activities increased public awareness of the pollution from older vehicles to some extent. NFPs organized outreach events at venues such as fairs, festivals, parades, auto shows, environmental shows and markets. Displays varied among provinces but would often include RYR-branded booths, promotional vehicles, representatives in RYR-branded clothing, and sustainably produced giveaways (e.g., RYR bike lights, water bottles).
Survey results indicate that program awareness increased significantly as the program was implemented and as it matured. In 2008, a survey of model-year 1995 and older car owners found that 33% of older-car owners were aware of vehicle scrappage programs in Canada. The survey was conducted again in 2010 and results indicate that, following the launch of RYR, the proportion of model-year 1995 and older vehicle owners who have seen or heard something about a vehicle scrappage program had more than doubled.
The program participants were asked how they heard about the program, which is another indicator of the effectiveness of the marketing and outreach activities. The percentage of program participants who heard about the program through ads decreased from 22% in June 2009 to 15% in January 2010, then rose to 28% in December 2010. Between June 2009 and December 2010, word of mouth as a source declined from 34% to 24%, and the Internet as a source declined from 15% to 6%. In all cases, the marketing efforts of 2010 (including program ads, partner ads and outreach activities) appeared to have a significant impact.
The 2008 survey of model-year 1995 and older vehicle owners indicated the extent to which these owners were aware of the environmental impacts of their vehicle. When asked what makes some vehicles more polluting than others, based on what they know or may have heard, the most frequently cited factor was how a vehicle is maintained (45%), followed distantly by its age (19%), fuel type (16%), vehicle or engine size (14%), its type of pollution reduction technology (11%), and other factors. However, the majority (65%) of drivers of older vehicles recognized that model-year 1995 and older vehicles pollute more than new ones.
Program participants were also asked to explain the rationale for their participation in the program. In 2009, 21% of participants cited concerns about environmental impact as the reason for retiring their vehicles, while in December 2010 only 10% cited this reason. The primary reason that participants chose to dispose of their vehicle was that it was no longer reliable/practical to keep (37% of respondents in December 2010).
c) Increased awareness by recyclers of environmentally safe recycling practices
Almost all KIs described the vehicle recycling code of practice as an important and valuable legacy of the program. The code was drafted by ARC, the national umbrella organization representing the auto recycling industry, under a contract with EC and other stakeholders. The idea for a recycling code of practice and recycling audits, which originated from ARC, was based on a pre-existing code in B.C., a best practices guide in Quebec, and best practices in other countries such as the United States. The code was published in print and electronic formats and was widely and readily available to auto recyclers across the country. ARC operates a website that includes the code and related training materials. ARC also made presentations to and attended meetings with auto recyclers, to promote the code.
Interview respondents stated that the positive impact of the code on auto recycler awareness of environmentally safe recycling practices was one of the program’s successes. Over 350 vehicle recyclers were RYR partners, and according to program documentation, efforts were made to increase the recyclers’ awareness of the importance of environmentally safe recycling practices and of the code. SI conducted in-person training on the code with recyclers across Canada. To maximize the code’s influence, training was free and recyclers were not required to be part of RYR in order to attend. In-person recycler training on the code was held in 16 locations in seven provinces covering all regions of the country. Over 200 companies attended the training sessions, with many companies sending two or more participants. Approximately 200 DVD copies of the training were distributed, and 78 companies took the online training course.
Implementation of the code in the North was explored, but found to be not feasible. The North is far from markets for scrap metal, and attracting partners is more difficult given that transportation costs are higher than the scrap metal value. Moreover, in the Northwest Territories, there are only a few vehicle recyclers, and they were not in a position to meet the code’s requirements.
In addition to the training, 92% of participating RYR recyclers were audited to verify their adherence to the code.e vast majority (92%) were found to be in compliance. The four auditors hired to conduct on-site vehicle recycling audits played an important role in informing and educating recyclers about the code and how to make improvements to their businesses. Recyclers were aware of the website, although they appreciated the site visits by auditors and the information provided in person.
EC managers cautioned that it is difficult to know the extent to which recyclers not involved with the NVSP are aware of the code and are following its recommendations. However, audits of the recycling companies that were involved with the program demonstrate that the great majority are following the code. ARC estimates that larger and mid-sized auto recycling companies that follow the code, whether or not they are participating in the program, could be recycling up to 80% of the vehicle components (in most regions of the country).
SI respondents expressed concern about the long-term sustainability of the code after the program ends. A provincial NFP also expressed a concern that auto recyclers say there is no overarching regulatory body to oversee their practices. This NFP further wondered if the auto recyclers will continue with environmentally safe practices. More optimistically, SI stated that they have established “deeper relationships” with auto recyclers and that these relationships will help promote awareness of evolving environmentally safe auto recycling practices.
Performance – Effectiveness
11. To what extent have the intended outcomes been achieved as a result of the Vehicle Scrappage Program?
Medium-term outcomes:
d) Fewer older, high-polluting personal vehicles on the road
Rating: Progress Made; Attention Needed
e) More sustainable transportation modes being used for personal transportation
Rating: Little Progress; Priority for Attention
f) Environmentally safe practices in use for recycling of vehicles scrapped through the program
Rating: Achieved
Findings:
138 600 vehicles were retired by the program, although evidence indicates that some of these vehicles would have been retired in the absence of the program.
As the program was not fully implemented until 21 months after program inception, the program did not reach its initial overall target of 200 000 vehicles retired over 48 months. Some regions had difficulties reaching their targets due to a lack of recycling infrastructure and other logistical issues.
Most of the program’s users preferred the cash incentive and replaced their vehicles with another one. The manufacturer rebates affected the type of replacement vehicle purchased, as more program users who obtained rebates opted for larger vehicles than the ones they retired
Environmentally safe practices in the recycling of vehicles were promoted during the program by requiring all participating recyclers to adhere to the recycling code of practice. ARC reported that it now has approximately 450 member companies nationally, most of whom adhere to the code.
d) Fewer older, high-polluting personal vehicles on the road
As indicated earlier, the program goal was to retire 50 000 vehicles per year, for a total of 200 000 vehicles over four years. As of March 2011, approximately 138 600 vehicles were retired as a result of the program (see Table 6). Although the target of 50 000 vehicles per year was reached, the program was not fully operational until 21 months after program inception and thus did not reach its initial overall target.
| Province | Number of Applications Received by the Program | Number of Vehicles Permanently Retired* | Number of Active Recyclers at Program End |
|---|---|---|---|
| * Number of vehicles off the road and handed over to recyclers Source: RYR statistics (website) |
|||
| Alberta | 14 692 | 11 692 | 23 |
| British Columbia | 19 527 | 19 030 | 27 |
| Manitoba | 6313 | 5519 | 4 |
| New Brunswick | 2239 | 1806 | 11 |
| Newfoundland and Labrador | 1585 | 1269 | 10 |
| Nova Scotia | 3199 | 2575 | 23 |
| Ontario | 57 355 | 50 485 | 120 |
| Prince Edward Island | 959 | 758 | 4 |
| Quebec | 47 363 | 40 419 | 109 |
| Saskatchewan | 6239 | 5089 | 16 |
| Total | 159 471 | 138 642 | 347 |
According to documentation, Alberta and Newfoundland and Labrador experienced challenges reaching their original 2009–2010 targets. These provinces were challenged by a lack of recyclers who were willing to participate in the program due to geographic challenges and market forces. As there are no steel processors in either province, there is an additional logistical and financial burden of shipping processed vehicles out of province, thus making the financial model for recyclers less attractive and making it more difficult for the program to recruit recyclers (SI 2010d, p. 26).
Nevertheless, the program exceeded its annual targets for the 2009–2010 period (calendar years) by approximately 18%. However, the impact cannot be entirely attributed to the program: according to survey results, 61% of participants stated that they retired their vehicles earlier than expected as a result of the program (39% said the opposite) (Environics Research Group 2011). This finding indicates that the results cannot all be attributed to the program, as it is likely that some of the impacts would have occurred in the program’s absence. However, the exact level of attribution would be difficult to assess considering the following:
Despite the above factors, it is still likely that a significant percentage of participants would have retired their vehicle in the program’s absence, which leads the evaluation team to conclude that not all observed impacts are attributable to the program.
e) More sustainable transportation modes being used for personal transportation
According to program statistics, more than 90% of program participants chose the $300 cash incentive after retiring their vehicle, while only 7% of participants selected a sustainable transportation reward (e.g., a transit pass, bicycle discount, car share). The majority of participants replaced or were planning to replace their retired vehicle with another one (75% in 2009 and 86% in 2010, according to survey results), while 22% of participants in 2009 and 12% in December 2010 had no plans to replace their vehicles.
British Columbia provided the highest-value non-cash alternative transportation rewards, and therefore made the biggest impact in shifting participants away from vehicles. This was likely due in part to the significant contribution of additional incentive funds from the provincial government (e.g., $750-value car-sharing membership, up to $2,000 in free transit passes, rebates on the purchase of new fuel-efficient vehicles).
As shown in Table 7, the majority of those who replaced / were planning to replace their vehicle in 2009 were considering replacing it with a car (74%), while 18% were considering a truck, sport utility vehicle (SUV) or van. Unfortunately, the percentage of those planning to purchase a car rather than an SUV or van fell to 46% in December 2010.2
| Type of Vehicle | 2009 | Jan. 2010 | Dec. 2010 |
|---|---|---|---|
| Source: Survey of Program Participants, Environics Research (1000 respondents for each time period) | |||
| Car | 74 | 57 | 46 |
| Truck | 7 | 21 | 34 |
| SUV | 8 | 11 | 12 |
| Van or crossover | 3 | 3 | 2 |
| Don’t know / not sure | 8 | 7 | 5 |
Approximately 3% of participants replaced their vehicle with a model-year 1995 or older vehicle, and approximately 13% replaced it with a vehicle manufactured between 1996 and 2003 (not shown).
The effect of the above substitutions (vehicles replacing retired vehicles) depends on the type of vehicle. As noted above, approximately 16% of the vehicles replacing the retired ones are pre-2004 models, which reduces the smog emissions reductions achieved by the program given that these vehicles emit approximately eight times more smog-forming emissions than 2004 and newer vehicles. Data also show that many of the replacement vehicles are in the medium to large size categories and would likely produce larger amounts of GHGs than the vehicles they are replacing. These factors were taken into account in the calculations of the program’s reductions of smog and GHG emissions (reported in Table 8).
KIs acknowledged the difficulty of shifting people to other modes of transportation. NFPs noted that, although there are fewer older, high-polluting cars on the road, the program was not effective at encouraging Canadians to use more sustainable modes of transportation. One stated that “the vehicle manufacturers took up all the space” and that more incentives could have been related to sustainable transportation if the vehicle manufacturers had not been involved.
One lesson learned by EC was that without providing any funding for vehicle rebates, there was no control over what incentives were offered by auto manufacturers. Because the manufacturers offered bigger discounts on large vehicles, purchases of these vehicles were higher. SI consulted with the auto manufacturers about their incentive structure but the industry was reluctant to make changes.
f) Environmentally safe practices in use for recycling of vehicles scrapped through the program
Environmentally safe practices for the recycling of vehicles during the program were promoted by requiring all participating recyclers to adhere to the recycling code of practice. EC respondents indicated that the code’s main objective was to use it and the RYR program to “start the conversation” with smaller providers that may not have the infrastructure to follow the code and to start them on a path to better practices.
ARC reported that, traditionally, the mid-sized recyclers were not concerned about anything “environmental.” Many recyclers wanted to become involved in RYR for financial reasons (i.e., access to a supply of cars). However, following dissemination of information about the program and code, ARC received an increased number of applications to join the association from recycling companies agreeing to adhere to the code’s requirements. Auto recycling industry representatives reported that development of the code has led to “an amazing change in the industry.” The biggest positive change was among mid-sized companies; the larger auto recyclers already were following environmentally safe practices for the most part.
Application of the code was enforced by on-site audits conducted to assess adherence. ARC was responsible for administering the audits and managing the auditors. Some 348 recyclers were audited at least once:
Results of the 2011 Vehicle Recycler Survey indicate that RYR succeeded with participating recyclers on numerous levels:
In the initial period of time following introduction of the recycling code of practice, ARC and auditors of vehicle recyclers reported that many recycling companies were “nervous” about the code and did not wish to participate. Through contact with recycling companies, the four auditors influenced these companies to realize that the code is a “work with” tool about training and making improvements. The auditors played a very important role and were responsible for showing many auto recyclers how the program and the code worked. This has led to increased adherence to the code.
ARC reported that it now has approximately 450 member companies nationally, most of whom adhere to the code. Significant developments in the provinces are as follows:
NFPs reported that some auto recyclers are proud to advertise themselves as environmentally conscious. One stated that “recyclers are proud to say they got the certificate from passing the Retire Your Ride audit.”
Performance – Effectiveness
11. To what extent have the intended outcomes been achieved as a result of the Vehicle Scrappage Program?
Long-term outcomes:
g) Air pollutants are reduced
Rating: Achieved
h) Greenhouse gas emissions are reduced
Rating: Progress Made; Attention Needed
i) Release of harmful and toxic substances into the environment is prevented
Rating: Achieved
Findings:
EC data indicate that the program contributed to reduced emissions of NOx, VOCs and GHGs. Total reductions are estimated to be approximately 5000 tonnes of VOCs and NOx, and about 37 500 tonnes of GHGs.
Based on differing emissions from model-year 1995 and older vehicles that were scrapped, and their replacement by either newer units or alternative means of transportation, EC calculated the total annual emission savings based on program participation, Statistics Canada information on average kilometres driven, and other information sources (EC 2010b). Estimated total reductions are approximately 5000 tonnes of VOCs and NOx, and 37 500 tonnes of GHGs (see Table 8). Annual targets were exceeded for reductions of VOCs and NOx, but were not met for GHG reductions.
| Annual Target | Annual Results (12-month periods) |
Total for RYR (27 months)* |
||
|---|---|---|---|---|
| 2009-10 (Fiscal Year) | 2010-11 (Fiscal Year) |
|||
| * Total reductions for RYR include an additional three-month period (January-March 2009) not reflected in the annual targets. Source: EC project database |
||||
| Number of vehicles retired | 50 000 | 65 200 | 69 900 | 138 600 |
| Emission Reductions (Tonnes) | ||||
| NOx + VOCs | 2250 | 2350 | 2520 | 5000 |
| GHGs (CO2 eq) | 54 000 | 17 700 | 18 900 | 37 500 |
The level of emission savings is affected by the age and types of vehicles being purchased to replace the older vehicles. According to survey results, about 30% of participants replaced their vehicles with used vehicles and/or trucks and SUVs.3
Performance – Effectiveness
12. Did this program lead people to make use of other related federal and provincial government programs or vice-versa?
The evaluation examined this question using KI interviews.
Rating: Not Applicable (Insufficient Evidence)
Findings:
Outreach and promotional materials for RYR were linked to two other federal government initiatives: ecoENERGY for Personal Vehicles (e.g., driving tips, buying a fuel-efficient vehicle), and Q&As on the admissibility of the RYR transit incentive for the federal transit pass tax credit. In addition, the original plan was to cross-promote RYR and another federal program (ecoAUTO), but ecoAUTO was terminated in March 2009. The evaluation team was unable to find evidence of the degree to which people made use of other related programs.
Outreach and promotional materials for RYR were linked to two other federal government initiatives: ecoENERGY for Personal Vehicles (e.g., driving tips, buying a fuel-efficient vehicle), and Q&As on admissibility of the RYR transit incentive for the federal transit pass tax credit. In addition, EC managers reported that the original plan was to cross-promote RYR and the ecoAUTO Rebate Program. However, ecoAUTO was terminated in March 2009, only three months after RYR was launched.
On a related point, three provinces (B.C., Manitoba and Quebec) contributed to the program by topping up the incentives for participants. According to EC interview respondents, program efficiencies were achieved by combining provincial and federal funding rather than setting up separate programs.
Performance – Effectiveness
13. Were there any external factors outside of the Vehicle Scrappage Program that influenced (positively or negatively) the success of the program?
The evaluation examined this question using KI interviews, documentation and case studies.
Rating: Not Applicable
Findings:
Many factors had an impact on the NVSP’s success, including the existence of previous programs, the influence of a similar U.S. program, the auto manufacturer rebates, and the economic recession. The U.S. program involved a major awareness campaign that reached Canadians, which contributed to increased take-up for RYR. The manufacturer rebates also increased take-up, but some focused on larger vehicles. The recession had both positive and negative effects.
A number of external factors were identified by respondents and confirmed by documentation as influencing program success:
Pre-existing provincial programs. The fact that a number of NFPs were already involved in vehicle scrappage and had existing expertise and partners made it easier to launch a national program. However, the existence of provincial scrappage “program names” resulted in lower visibility for the RYR name. There were also operational challenges related to provincial NFPs wanting to retain their modes of operation, which led to some “growing pains” when the national program was launched.
U.S. Cash for Clunkers program. Cash for Clunkers was launched midway through RYR. This American program (and to a lesser extent other international programs) received extensive Canadian media coverage, which led to increased awareness of RYR. It also led to some criticisms of RYR, because the U.S. cash rebates were larger than the Canadian rebates (i.e., $4,000 per vehicle in the U.S. vs. $300 in Canada). Cash for Clunkers was designed as an economic stimulus program and only offered vehicle rebates, while the Canadian program was designed as a clean air / environmental program and offered a range of incentives.
Auto manufacturer rebate programs. According to multiple sources, the combined rebates offered by the auto manufacturers had a significant impact on the program and its performance. GM, Ford, Hyundai, Chrysler, VW and Mazda all launched incremental rebates ranging from $500–$3,000. These rebates were offered in addition to the federal rewards. Participant applications would peak during these offers, although manufacturers had the option in their contracts to “go dark” (i.e., stop offering rebates) at certain periods, often with only several days notice. Ford and GM “went dark” in early March 2009, which resulted in a decrease in applications despite a communications campaign by SI (SI 2010d, p. 13).
Although the combining of NVSP rewards with the manufacturer rebates stimulated program use, it also had an impact on program GHG emissions reduction results. In general, the value of the rebate offered by the manufacturers increased with vehicle size, which led to more participants purchasing replacement vehicles that were larger than those retired. Because the NVSP’s terms and conditions did not allow the use of incentive funds for vehicle rebates, the manufacturers designed and solely funded this part of the program, which meant that neither EC nor SI had any leverage to influence the rebate structure or encourage greater incentives for fuel-efficient vehicles. This is why program participants were more likely to purchase trucks, SUVs and vans in 2010 than in 2009 (discussed earlier).
Provincial government incentives. The financial participation of provincial governments, particularly B.C. and Quebec, increased program take-up. Provincial funding was mostly directed toward transit incentives, which helped to increase the popularity of non-cash incentives.
Impact of recession on participation. The recession / weak economy may have led some potential participants to keep their old cars due to a reluctance to invest in a newer vehicle during difficult economic times. The NFPs believed that, for some potential participants, the incentive was not enough to motivate them to give up their cars. NFPs also noted that the recession made it more difficult to leverage funds for incentives from some organizations.
Low scrap steel prices. The economic recession during the early stages of the program led to low prices for recycled steel, which affected the number of recyclers who wanted to participate in RYR. NFPs reported that low steel prices made it challenging at the beginning to recruit enough auto recyclers to ensure good geographic and market coverage to serve all participants.
Market for recycled auto parts. The reluctance of the insurance industry and consumers to use recycled auto parts reduces revenues for the recycling industry, which may limit the widespread adoption of environmentally safe practices by auto recyclers. Environmentally safe practices involve added costs (or at least additional investments), which can appear less attractive if revenues are lower due to lower resales of recycled parts. On the positive side, the insurance industry, the customers of auto recyclers, and the suppliers of cars to auto recyclers have become more knowledgeable about recycling practices and increasingly want to deal with companies that employ environmentally safe practices.
Performance – Effectiveness
14. Were there any unintended positive or negative outcomes of the Vehicle Scrappage Program?
The evaluation examined this question using KI interviews, documentation and case studies.
Rating: Not Applicable
Findings:
The program had limited ability to influence program user transportation choices after the incentive was provided. As a result, many participants replaced their vehicles with large or older vehicles. On the positive side, the program helped build NFP capacity, and the impacts of the recycling code of practice were beyond expectations. The program also had economic benefits in the recession context, as well as social benefits by removing older, less safe vehicles and replacing them with new, safer vehicles.
The following unintended outcomes were identified in documentation and interviews:
Considering the timing of the program, new vehicle purchases are a major unintended impact of the NVSP. Based on participant surveys, between 37% (2009 survey) and 61% (December 2010 survey) of participants were planning to replace or did replace their old vehicle with a new one. Assuming a new car purchase rate of 45%, this equates to 43 875 new vehicle purchases (0.45 × 97 500 participants) linked to the program. This finding can be interpreted as a significant impact on the Canadian economy, in particular considering that the economy was at a low point in 2009 and 2010. It is beyond the scope of this evaluation to assess the exact value of this impact, but for illustrative purposes, Table 9 provides an approximate estimate (although it is agreed that the program only contributed partially to this impact).
| A. Number of New Vehicles Purchased (2009 and 2010) | B. Approximate Average Value per Vehicle (1) | C. Total Value of Vehicles Purchased (Benefit for Canadian Economy) (A × B) | D. Approximate Tax Revenues for the Federal Government (Based on 5% GST) (C × 0.05) | |
|---|---|---|---|---|
| (1) Based on Statistics Canada, New Motor Vehicle Sales (December 2009), Catalogue no. 63-007-X. | ||||
| Totals | 43 875 | $25,000 | $1,096,875,000 | $54,843,750 |
These numbers, which would be less significant in an economy growing at “normal” rates, become significant considering that the purchases were made in a period when auto manufacturers were experiencing a severe cutback in demand, and government was in a deficit period. It is also important to note that these impacts are not entirely attributable to the program, given the significance of auto manufacturers’ rebates (which were not subsidized by RYR) and other contributing factors.
It is likely that the program also had positive social impacts by removing older cars and replacing them with new vehicles equipped with better safety features. According to Statistics Canada (2008), many competing factors increase or decrease the risk of motor vehicle accidents and injuries. Technological advances such as anti-lock braking, airbags, improved seatbelts and child restraints make vehicles safer. For example, sources indicate that the gradual implementation of airbags in the 1990s has significantly reduced fatality rates. Although airbags are still not a mandatory requirement by Transport Canada, most automakers had gradually adopted this technology for their products by the end of the 1990s. According to a Transport Canada study (Transport Canada 2001), the number of saved lives associated with airbags significantly increased beginning in 1997: it is estimated that approximately 50 lives were saved annually between 1997 and 2000 due to airbags. Other technological improvements such as ABS braking systems and electronic stability control have also saved lives, according to American sources (National Highway Traffic Safety Administration 2010). So it is likely that the program has helped reduce fatalities through the replacement of less safe vehicles.
Evidence indicates that program resources were well used. EC and SI monitored performance and introduced corrective measures to ensure program efficiency. An efficiency analysis indicates that the proportion of total program costs utilized for administrative costs was low for the NVSP compared to a similar program, the ecoAUTO rebates. As well, significant resources were leveraged by the program: based on an analysis of all incentives provided to program participants divided by the total cost of incentives provided by the federal government, a 3:1 leveraging ratio was achieved.
Few alternative program models were identified by KIs. An alternative approach, used in certain foreign programs, would have been to offer more significant incentives and/or prescribe the types of substitute vehicles that could be purchased.
Performance – Efficiency and Economy
15. a) Did the Vehicle Scrappage Program undertake its activities and deliver its products in the most efficient manner?
Rating: Achieved
c) How could the efficiency of the program’s activities be improved?
Rating: Not Applicable
16. Did the Vehicle Scrappage Program achieve its intended outcomes in the most economical manner?
Rating: Achieved
The evaluation examined these questions using KI interviews, a review of literature and documentation, and an analysis of program financial data.
Findings:
Evidence indicates that program resources were well used. As well, evidence shows that EC and SI monitored performance and introduced corrective measures to ensure program efficiency. An efficiency analysis indicates that the proportion of total program costs utilized for administrative costs was low for the NVSP compared to a similar program, the ecoAUTO rebates.
For the purposes of this evaluation, the same data sources were used to assess efficiency and economy, including qualitative and quantitative information on the use of program resources.
EC respondents provided views on the extent to which program resources were well used. At the time of the interviews, they noted that the program was coming in under cost: the program had a budget of $92 million, whereas costs are projected to be approximately $68 million. The program also leveraged significant amounts of resources (see below). Some amounts advanced to NFPs remained unspent, mainly in marketing. At the other end of the spectrum, some NFPs reported that they were in over-budget situations.
Some NFPs and auto manufacturers reported problems concerning efficiency. Although most NFPs thought that the process was efficient, a few mentioned that there were missed opportunities, including better data systems. It was reported that SI struggled to find the appropriate resources (in human resources) when launching the program. Some of the systems used by the provincial organizations did not work very well, especially at the beginning, and there was poor liaison between SI and regional delivery partners.
As discussed earlier, monitoring systems uncovered difficulties, and the program implemented a number of successful corrective measures regarding delivery.
To assess efficiency and economy, the evaluation team calculated the percentage of total program costs used for administrative costs. This is a standard approach in evaluation of efficiency, and should involve a comparison with similar programs to assess the program’s level of administrative costs. The evaluation team established this percentage for the NVSP and compared it with a similar federal program, the ecoAUTO rebates.
The analysis of the NVSP’s cost structure indicates that, compared to other similar programs, the NVSP can be considered cost-efficient. Table 10 presents the cost structure for 2009-2010, which would be representative of the program in full delivery mode. As shown, the program involves EC internal administrative costs (salaries, benefits, O&M and corporate support), SI administrative costs, and a significant amount in G&C (mainly for SI but also for other NFPs involved in delivery of the program).
Table 10: NVSP Efficiency Analysis (2009-2010 Fiscal Year)
Cost Components
2009-2010 (Actuals)
Salaries
$260,962
Employee benefits plan
$52,192
O&M
$760,400
Corporate support
$481,543
SI administrative costs
$339,000
Total administrative costs (A)
$1,894,097
G&Cs
$26,594,268
Total Costs (B)
$28,488,365
% Administrative Costs (A/B)
6.6%
Source: Program financial data, SI financial statements
The percentage of administrative costs was calculated by dividing the administrative costs of EC and SI by the total costs. As indicated above, the proportion of administrative costs is 6.6%, which is considered highly acceptable for a program of this type.
As a comparison, the evaluation team assessed the same percentage for another federal program, Transport Canada’s ecoAUTO Rebate Program, which also provided rewards to promote more sustainable personal transportation behaviour, namely the purchase of a fuel-efficient vehicle. However, ecoAUTO was primarily delivered by Service Canada, whereas the NVSP was primarily delivered by SI and other NFPs. The financial analysis is provided in Table 11.
Table 11: ecoAUTO Rebate Program Efficiency Analysis
(2008-2009 Fiscal Year) (in $ Thousands)
Cost Components
2008-2009
Salaries and operating costs (Transport Canada)
$1,897
Salaries and operating costs (Service Canada)
$7,717
Total administrative costs (A)
$9,614
G&Cs
$119,864
Total Costs (B)
$129,478
% Administrative Costs (A/B)
7.4%
Source: Program data (reported in Transport Canada 2010)
As shown above, the administrative costs for ecoAUTO represented 7.4% of total program costs. Although this percentage is more than acceptable, the NVSP demonstrated a slightly lower proportion for administrative costs, despite the fact that it has a smaller program budget (larger programs, i.e., ecoAUTO in this case, can benefit from economies of scale and reduce their administrative costs).
Further evidence indicates that the contribution funding used by regional NFPs for program delivery was approximately 30% of the total funding, with the remaining amount being used for incentives. This exceeded the objective of allocating no more than 25% of the contribution funding to program delivery. The cost of extra advertising (used by some NFPs as a partial replacement for advertising cancelled by EC) is responsible for most of the larger program delivery cost.
Another indicator that can be used to assess efficiency is the government administrative cost per grant (in this case, per vehicle). Table 12 compares the above programs and Cash for Clunkers, and provides the costs of the incentives for the governments and the average value of the incentives received by participants.
| NVSP (2009 and 2010) | ecoAUTO (entire program) | Cash for Clunkers (entire program) | |
|---|---|---|---|
| Sources: Program financial data; SI financial statements; Transport Canada; U.S. Department of Transportation | |||
| Number of vehicles | 65 200 | 169 255 | 677 842 |
| Federal government’s administrative cost per vehicle | CAN $126 | CAN $98 | USD $114 |
| Average incentive cost to federal government | CAN $300 | CAN $1,124 | USD $4,209 |
| Average incentive value to participant | CAN $934 | CAN $1,124 | USD $4,209 |
As shown above, the administrative costs per vehicle for all three programs are similar. The NVSP’s costs are the highest but it also had a smaller economy of scale (it was a smaller program in terms of total funding).
An indicator of the NVSP’s cost efficiency is a comparison of the government’s incentive cost to the incentive value delivered to program participants. For the NVSP, federal incentive costs were leveraged via partnerships into incentive values of a much higher level (over 3:1); the NVSP’s administrative costs reflect the work involved in developing partnerships. The other two programs did not leverage any funding, which means the federal incentive costs were the only driver of value to participants.
In its evaluation of the clean transportation theme of the CAA, Transport Canada (2010) concluded that the NVSP and ecoAUTO are efficient compared to similar programs, but not cost-effective for reducing GHG emissions (based on an analysis of the estimated cost to the federal government for each tonne of GHGs reduced). However, the reduction of GHG emissions was only a secondary goal of the NVSP.
Performance – Efficiency
15. b) Was federal funding leveraged to the extent planned?
Rating: Achieved
d) Are there alternative, more efficient ways of delivering the program?
Rating: Not Applicable
The evaluation examined these questions using KI interviews and a review of documentation and literature.
Findings:
Evidence indicates that significant resources were leveraged by the program. Based on an analysis of the value of all incentives provided to program participants in relation to the total cost of incentives provided by the federal government, a 3:1 leveraging ratio was achieved.
Few alternative approaches were identified by KIs. Foreign programs show that alternative approaches exist, including the use of more significant incentives with conditions on the types of substitute vehicles purchased.
Documentation and interviews with EC staff indicate that significant resources were leveraged by the program. For example, it is estimated that recyclers paid approximately $7 million to call centres in order to contribute to the centres’ operating costs. In addition, SI was funded by vehicle manufacturers to provide accelerated processing of registrations of their customers. Provincial contributions of nearly $10 million were also received. In terms of investments disbursed by program partners, an estimated $84 million was leveraged in the form of incentives from partners. Overall, as indicated in Table 13, the leveraging ratio achieved was approximately 3:1, which was the program’s goal.
Table 13: Leveraging of Federal Funding for Incentives
Funding Partners –
Contribution to Incentives
$ Millions
Provincial governments
$9.7
Vehicle manufacturers and dealers
$70
Transit authorities
$3.1
Bicycle retailers, car-share programs, etc.
$1.3
Subtotal
$84.1
Federal Government –
Contribution to Incentives
Environment Canada (A)
Subtotal
$41.6
Total Incentive Value (B)
$125.7
Leveraging Ratio of Total Incentive Value to EC Contribution (B:A)
3:1
Interview respondents (NFPs) identified various alternative delivery approaches, including having separate contribution agreements with each regional NFP. Many NFP respondents said that SI did not have the capacity to deliver the program without regional partners. According to EC respondents, there were no alternative ways of delivering the same program with the same level of success at significantly less cost.
For example, a centralized “1–800” program with solely national incentives may have been more cost-efficient but would have lacked many valuable local/regional contributions and financial leveraging, e.g., local incentives, local outreach, and local brand recognition.
Another alternative would have been to lower the amount of the incentive. Program staff indicated that the $300 cash incentive was already a bare minimum, suggesting that a lower incentive may have reduced the program’s incremental impact.
The program did not implement the originally planned advertising campaign, reducing EC costs by approximately $5 million, but SI increased its initial budget allocation for advertising by approximately $2 million, for a net cost saving in the area of $3 million.
Foreign Programs. Other programs were implemented abroad and are considered here as potential alternatives. Programs reviewed include those in the United States, United Kingdom, Germany and France (judging the efficiency of these programs is beyond the scope of this study). Details of each program are provided in Annex 5. The review found the following:
1 Media impressions are measured by the number of people who have seen an article, heard something on the radio or in a podcast, watched something on television, or read something on a web page or blog.
2 The Canadian market for new vehicles shifted during the program. At the start (January 2009), passenger cars accounted for the majority of new vehicle sales (54% cars and 46% light-duty trucks [van, pickup, SUV]) in Canada. At the end of the program (March 2011), light-duty trucks accounted for the majority of sales (44% cars and 56% light-duty trucks).
3 Emission reductions are the difference between emissions from the retired older vehicle and its replacement. The calculations considered only vehicles retired through the program and only the year following vehicle retirement. Surveys of program participants conducted 6–12 months after their participation were used to assess transportation behaviour after the retirement of the older vehicle. Survey data included whether a replacement vehicle was purchased (and the model year and category of this replacement vehicle), or if other means of transportation were used (e.g., transit, car sharing). The calculations also used published data for emission factors, annual vehicle usage, and transit data.