Source: Internal Survey on R&D alignment (2009).
Taking Stock of the Excellence and Relevance of EC’s R&D
In 2007, Environment Canada’s Science Plan outlined a ten-year vision for developing and exploiting the Department’s scientific capacity in support of its mandate. The effective mobilization of our scientific expertise requires that we develop performance measures. This effort to measure and report on Environment Canada’s research and development (R&D) activities is consistent with both the Science Plan and the Federal S&T Strategy, Mobilizing Science and Technology to Canada’s Advantage.
Engaging experts and stakeholders from across the Department, we developed a comprehensive, transparent framework to measure Environment Canada’s R&D activities. Using the Science Plan as a guide, alignment, linkages, excellence and enabling environment were chosen as the cornerstones for measuring the Department’s R&D performance. Readily accessible indicators were developed to examine R&D in terms of these four criteria.
I am proud to report that Environment Canada continues to be a world leader in environmental research, targeting high-priority scientific issues that matter to Canadians. I invite you to read this report, the first of its kind by the Department, in order to take stock of the quality and scope of research performed by our scientists and their teams.
I hope you will join me in welcoming this report as a very important step forward for Environment Canada. In addition, it sets the stage for the upcoming, more in-depth measurements of our performance, which will focus on the impacts of key research and expand the scope of departmental scientific activities we consider.
I also see this first report as a means to promote dialogue and collaboration in view of continually strengthening our scientific capacity and producing research that makes a difference to Canadians. I look forward to working with Environment Canada employees, and with our partners across the country, in achieving these objectives.
Brian T. Gray, Ph.D.
Assistant Deputy Minister
Science and Technology Branch
Science is central to Environment Canada’s ability to deliver on its mandate. It is performed and used throughout the Department and across the country to develop and implement effective environmental policies, programs and regulations, and to provide environmental and weather services to Canadians.
In order to clearly distinguish research and development (R&D) from other scientific work, this report relies on the Statistics Canada definition of R&D. R&D activities focus on the production of new scientific knowledge, as opposed to related scientific activities (RSA), such as monitoring, which focus on applying existing scientific knowledge.
R&D is the backbone of Environment Canada’s scientific capacity, providing the basic knowledge necessary to fulfill the Department’s mandate effectively and maintain public trust. About 15% of EC’s employees work in R&D and about 25% of EC’s total budget is devoted to R&D activities.
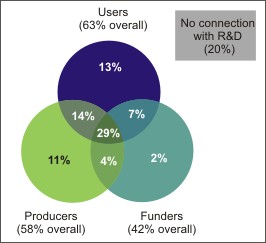
R&D supports the delivery of results across the Department. Developing new atmospheric models, for example, helps provide accurate forecasts and track harmful pollutants. New test methods serve to identify and detect toxic substances, and to protect Canadians and their environment from the adverse effects of these substances. Across the departmental management structure, 80% of Outcome Projects (OPs) report some direct connection to R&D, either as users, producers or funders (Figure 1); almost 30% play all three of these roles.
Figure 1: Proportion of OPs which produce, use and fund R&D.
Source: Internal Survey on R&D alignment (2009).
The logic model developed as part of the performance measurement framework (Figure 2) provides a general representation of how R&D contributes to achieving departmental strategic outcomes. The indicators used for this report correspond with various parts of the logic model system (inputs, outputs and activities).
Environment Canada is committed to ensuring that its R&D provides value for money and addresses environmental issues that are of the highest priority to Canadians. The Department set out its long-term science and technology (S&T) priorities in the 2007 Science Plan1. Laying out a vision for managing and conducting science, EC committed to measure progress and examine its performance as a science-based department. In the context of EC’s Science Plan, the present report is the first step in this direction. It is in line with EC’s efforts to meet Treasury Board requirements for performance measures for the Program Activity Architecture (PAA). It is also consistent with the Federal S&T Strategy, Mobilizing Science and Technology to Canada’s Advantage2.
Figure 2: Logic model for EC’s R&D.

* External influences could include public opinion, natural disasters, external stakeholders and domestic and international political events.
Environment Canada has built a performance measurement framework by engaging internal stakeholders and reviewing similar processes undertaken in Canada and elsewhere. Four principles, articulated in the 2005 Framework for Federal S&T3, have guided the performance measures report: alignment, linkages, excellence, and enabling environment (Figure 3). The present report brings together readily available qualitative and quantitative indicators for each of these principles, based on four distinct sources of performance data:
Figure 3: The performance measurement framework for EC’s R&D.

The present report, the first of its kind and scope for EC, measures the Department’s performance in R&D. It is a first step in an ongoing project to assess the Department’s scientific activities and impacts.
The structure of this report mirrors the four principles of the performance measurement framework (Figure 3), highlighting the main findings for each one. In addition to quantitative indicators, concrete examples help illustrate several aspects of departmental R&D. A summary of key findings is provided at the end of the present report.
Alignment of the Department’s R&D activities means targeting priority and mandated issues that reflect both the current and the long-term concerns of Canadians. To be well aligned, R&D must be relevant, timely and adaptable.
Relevance must be attained at multiple levels. R&D must be relevant to the Department’s mandate, its current priorities and the broader priorities of the Government. R&D activities should reflect long-term, ongoing objectives at the departmental and federal levels. R&D results must also be available to users when they are needed, while recognizing that R&D users and producers work on different time scales. Lastly, alignment is about adaptability: R&D should be responsive to emerging scientific and policy issues. Goals and priorities evolve, and alignment requires ongoing monitoring and adjustment of the direction of R&D activities.
Given that Environment Canada is a science-based department, it is important to measure the alignment of the R&D performed. Over half of the OPs surveyed perform some R&D (Figure 1), and approximately one-quarter of the departmental budget is devoted to R&D activities.
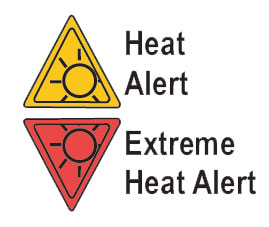
Mobilizing EC’s R&D to address emerging health issues: the Heat Alert System
Combinations of heat and humidity put human health at risk, adding to pressures on Canada’s healthcare system. Extremes can cause deaths, as seen recently in Europe in 2003, and in California in 2006. Municipalities need a reliable system to help them warn vulnerable populations to seek assistance before they are in danger.
In 2000, the City of Toronto, in partnership with Environment Canada and others, worked to develop a new Heat Alert and Emergency system. The system was based on careful analysis of the relationship between weather conditions and mortality, using over 46 years of climate data from Environment Canada and 17 years of epidemiological evidence. Toronto launched the system as a pilot in 2000, becoming one of only seven cities in the world with a heat alert system.
These warning systems are expected to become even more important in a changing climate. Research into climate change adaptation is a priority at EC. It has indicated that climate change could double or triple potential mortalities from heat and air quality related events on severe heat days (depending on the city considered) unless adaptation actions are taken and air quality emissions are reduced4.
The primary mechanism used to ensure the alignment of R&D with priorities is the departmental management boards. Environment Canada’s mandate is primarily articulated in terms of broad strategic outcomes that serve as the foundation for the Department’s Results Management Structure (Appendix 2). These outcomes are managed through four management boards: the Environmental Protection (EP) Board, the Weather and Environmental Services (WES) Board, and the Environmental Stewardship (ES) Board, with support via integration and enabling services from the Internal Services (IS) Board. These boards set the priorities for their respective outcome project groupings (OPGs).
A survey was conducted to understand in more detail how R&D contributes to achieving the priorities of the Department. It focused on R&D alignment with the Department’s mandate, as reflected in the departmental Results Management Structure. Under each of the management boards there are several OPGs, each comprised of numerous OPs. The survey was sent to a total of 131 OP leads across the Department—all OP leads from the three program boards (EP, WES, ES) were surveyed, as were a number of OP leads from the IS Board. The survey garnered a total response rate of 67%. This section of the report summarizes the main findings of the survey.
Strong connections between R&D producers and users across the Department help ensure the relevance of EC’s R&D
Strong connections exist between OPGs that produce R&D and those that use R&D (Figure 4). While these connections are usually strongest within individual boards, robust connections also exist between boards. Inter-board connections often happen through a core group of OPGs that serve as “R&D hubs.” These hubs can be seen as evidence of well-aligned and relevant R&D. One example of an R&D hub is the OPG leading the development of the Department’s ecosystem approach (1C1)—a priority activity for EC. This OPG is a major user of R&D from across the Department. Another example is the OPG leading climate and weather prediction research (2A2), which is both an important user and producer of EC’s R&D.
Figure 4: R&D links among OPGs. The arrows point from R&D producers to users and the thickness of lines represents the intensity
of links (i.e., the number of times links between OPs were reported). The names of the various OPGs can be found in the Results
Management Structure diagram in Appendix 2.
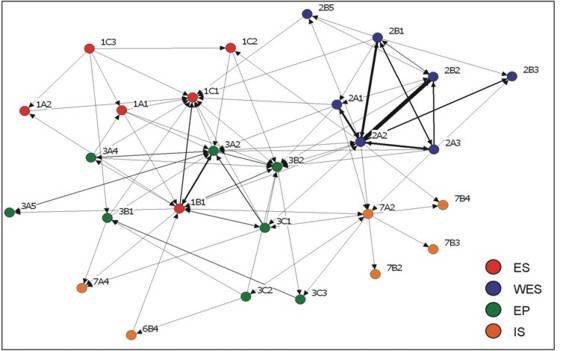
Source: Internal Survey on R&D Alignment (2009).
The relevance of R&D performed by EC extends beyond the objectives of individual boards
In-house research is the primary source of R&D for the Department. Of the OPs that rely on R&D, over 70% use R&D performed in-house by other OPs (Figure 5). This suggests that Environment Canada’s internal R&D capacity is relevant to and aligned with the needs of users in the Department. Those that do not use EC’s R&D often require specialized scientific information from outside EC’s areas of expertise (e.g. agricultural or policy research). The next most important sources of R&D for the Department are academic institutions and other federal government departments and agencies.
Figure 5: Frequency of R&D sources used by OP leads who rely on R&D.

Source: Internal Survey on R&D Alignment (2009).
EC’s R&D is relevant to government-wide priorities
OPs involved with the Chemicals Management Plan (which is led by OPG 3A2) are important users of R&D (see Figure 4 and Protecting Canadians from Toxic Substances, below). As a large-scale interdepartmental endeavour, the Chemicals Management Plan draws on a significant amount of the Department’s R&D expertise, including, for example, aquatic ecosystems research and atmospheric monitoring research, to help ensure Canadians and their environment are protected from toxic substances. Another priority area for the Department is the Clean Air Regulatory Agenda, which provides a consistent approach to regulating the emission of greenhouse gases and air pollutants across the county. It was found that this involves a number of different OPGs, linked together as users and producers of R&D.
EC’s R&D is relevant to the needs of many public- and private-sector clients
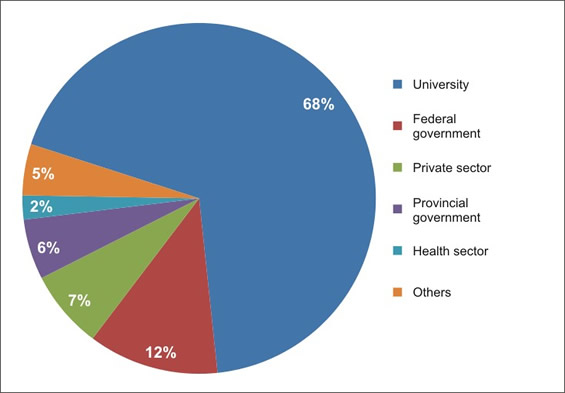
Environment Canada’s R&D is used by many external organizations, both nationally and internationally. The top external users of EC’s R&D are other federal departments and agencies (Figure 6), which suggests that there is some degree of alignment and coordination with other federal science performers. Horizontal interdepartmental initiatives such as the Chemicals Management Plan and the Clean Air Regulatory Agenda are evidence of the important R&D links between federal departments and agencies. EC’s R&D is also used extensively by a wide range of other organizations, including academic institutions, provincial and municipal governments, and private companies.
Figure 6: Frequency of sectors identified as direct users of EC’s R&D.
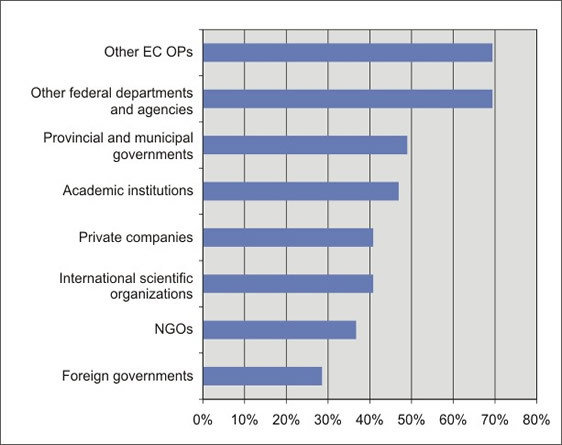
Source: Internal Survey on R&D Alignment (2009).
R&D performed by EC is delivered in a timely manner
The majority of OPs that fund or rely on R&D performed by Environment Canada feel that it is delivered in a timely manner. Responses indicate that, in general, internal R&D is accessible to users in a timeframe that meets the Department’s operational requirements.
R&D performed by EC is able to adapt to the priorities of its users
The majority of OPs that fund and/or rely on R&D performed by the Department feel that it is responsive to their priorities: indeed, 25% of respondents feel that it is “very responsive.” Only 16% of OP leads feel that this R&D is not responsive to their priorities. Satisfaction rates are highest when performers and funders/users are managed through the same board (this is true both in terms of adaptability and timeliness).
R&D provides key tools for environmental conservation and protection, as well as forecasting
The R&D performed by Environment Canada is directed toward four main types of work, some of which extend to related scientific activities (RSA): modelling of physical systems; monitoring; testing and standards development; and impact studies (Figure 7). The Department relies on its strong R&D-based modelling capacity to develop different types of environmental and weather forecasting, for instance. EC relies on impact studies and reliable methods for environmental testing and monitoring to develop policy, regulations and risk management approaches. EC’s R&D thus contributes to departmental efforts to conserve the environment and protect the health of Canadians.
Figure 7: Major internal applications of R&D performed by EC (by percentage of OPs who perform R&D).
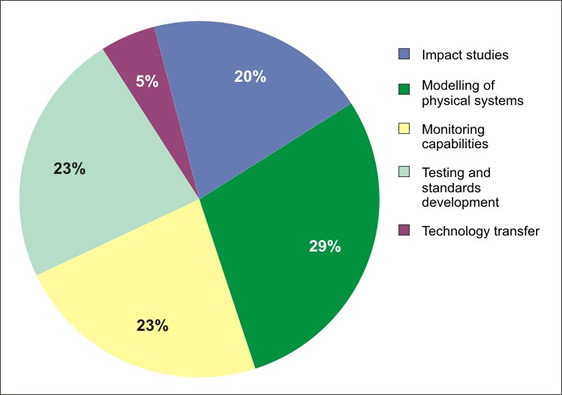
Source: Internal Survey on R&D Alignment (2009).
Directed R&D funding between OPGs helps EC target priority issues
Delivering on Environment Canada’s mandate means funds must flow between users and producers to address priority issues. Funds for R&D are targeted to address government priorities in areas such as contaminated sites, which involves a number of OPs under the EP and ES boards. By way of another example, the Technology Solutions OP (under the OPG 3B2; see Figure 4) supports energy and genomics R&D across the Department.
Protecting Canadians from Toxic Substances: R&D and the Chemicals Management Plan
The Chemicals Management Plan (CMP) is a fully integrated approach by Health Canada and Environment Canada to protect the health of Canadians and the environment from risks associated with toxic substances. It aims to integrate toxic substance activities across federal laws (i.e. Canadian Environmental Protection Act, Pest Control Products Act, Food and Drugs Act, Hazardous Products Act) and significantly strengthens and accelerates the risk assessment and risk management of existing substances while continuing to assess, manage and monitor new substances that enter the Canadian market.
Aligning R&D with priority issues, both for the Department and in the broader federal context, is an ongoing process. Environment Canada has a well-developed in-house R&D capacity to achieve these objectives. The R&D performed by the Department’s scientists is made relevant through strong connections within and among boards. The map of R&D connections across the board structure shows the degree to which R&D is a cross-cutting, enabling function for activities being carried out across the Department. R&D is generally being delivered in a timely manner and is adapting to the needs of its internal users.
In addition to delivering on Environment Canada’s mandate, R&D capacity is also focused on wider government priorities, as highlighted by the reliance of other federal departments and agencies on R&D performed by EC. Many other organizations, both public and private, also rely on EC’s R&D. For example, the Department’s R&D capacity contributes to research done at academic institutions, to regulation and standard development by provincial and municipal governments and international organizations, as well as to innovation in the private sector.
R&D in the Department is well aligned with priorities on a number of levels. There is clearly very strong alignment within each Program Board and there is evidence of important “R&D hubs” that cut across the boards.
As discussed in the following section, Environment Canada’s ability to produce well aligned and high-quality R&D also depends on its researchers being highly linked with collaborators from the public, private and non-profit sectors.
Building effective linkages means drawing together internal and external R&D capacity to deliver on EC priorities, and ensuring that the Department’s standing within the wider scientific community is maintained and enhanced.
Scientists at Environment Canada are active members of the wider scientific community, and as such regularly work with other scientists both nationally and internationally. Linkages with scientific partners take a number of forms. Most commonly, they involve working together on research projects that are of common interest. These research partnerships frequently result in publications in peer-reviewed scientific journals. Scientists in the Department are also linked to the wider scientific community through their affiliations with universities (e.g. as adjunct professors or research associates), and through teaching and supervising graduate students and post-doctoral researchers. Linkages help EC build synergies, leverage resources, and access expertise in other organizations. In addition to these external linkages, strong R&D connections also exist within the Department and interdepartmentally.
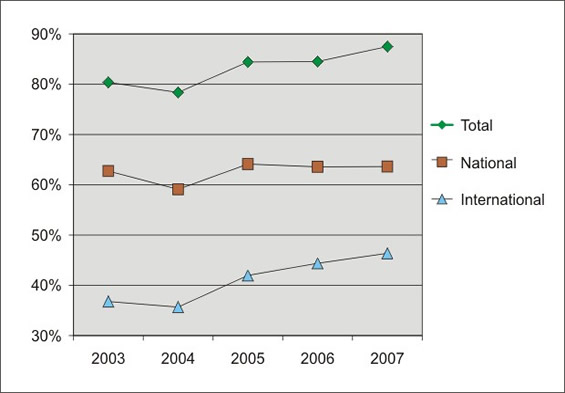
Figure 8: EC’s collaboration rates (2003–2007). Note that some papers are published with both national and international partners, so the sum of international and national collaborations is greater than the total number of collaborations.
Source: Scopus data compiled by Science-Metrix (2009).
A number of methods were used to measure the nature and quality of the linkages that Environment Canada scientists have established with researchers in other organizations. Bibliometric data was produced by Science-Metrix using the Scopus database of peer-reviewed publications. Publications co-authored by at least one EC scientist and one or more external authors are examined in this section. The term “collaboration” in this section refers specifically to peer-reviewed scientific publications involving external authors. An internal survey of OP leads (discussed in the preceding section) was also used, as was information from research scientists in the S&T Branch regarding their affiliations with other scientific organizations.
EC is collaborating more than ever, especially with international partners
Almost 90% of Environment Canada’s peer-reviewed scientific publications are co-authored with at least one external partner. This represents a significant increase: in 1990, EC’s total collaboration rate was only about 50%5. As shown in Figure 8, EC’s international collaboration rate has increased from 37% to 46% over five years, while national collaborations have remained fairly constant.
| Top 10 International Collaborating Institutions | Number of Co-authored Publications |
|---|---|
| NOAA - National Oceanic and Atmospheric Administration (USA) | 98 |
| NASA (USA) | 64 |
| USGS - US Geological Survey (USA) | 61 |
| CNRS - Centre national de la recherche scientifique (France) | 61 |
| National Environmental Research Institute - NERI (Denmark) | 44 |
| University of Colorado at Boulder (USA) | 42 |
| Helmholtz-Gemeinschaft Deutscher Forschungszentren (Germany) | 41 |
| University Corporation for Atmospheric Research - UCAR (USA) | 39 |
| Max Planck Society (Germany) | 38 |
| Chinese Academy of Sciences (China) | 35 |
Collaboration greatly increases the scientific impact of R&D performed by EC
Compared to EC publications produced without any external collaboration, papers with national collaborators are cited 40% more often, those with international collaborators are 80% more highly-cited and those with both national and international co-authors are cited twice as frequently.
Internationally, EC has strong R&D linkages with the U.S.
Five of Environment Canada’s top ten international collaborating institutions (Table 1) are from the United States, attesting to the Department’s close ties with U.S. federal science, as well as with leading U.S. universities. However, EC also collaborates extensively with scientists from around the world, most notably Europe, but also with scientists from China and Australia, among other countries. The majority of international collaborations are with foreign governmental organizations.
Most of EC’s national R&D collaborations are with universities
Almost 70% of Environment Canada’s national collaborations involve universities (Figure 9). The top three university collaborators are the University of Toronto, Carleton University, and the University of Saskatchewan (Table 2 and Figure 10). Significant linkages also exist with other sectors: federal departments and agencies, companies, provincial governments, and conservation groups. These findings are consistent with what the internal survey on R&D alignment (see previous section) revealed in terms of R&D exchanges between EC and various types of external organizations. The list of major collaborators varies significantly depending on the scientific area. For example, R&D in climate, meteorology and atmospheric sciences is mostly performed with university partners; research in environmental planning, management and conservation has greater links to the private sector and other federal departments and agencies, with the Department of Fisheries and Oceans (DFO), National Resources Canada (NRCan), Health Canada (HC) and Agriculture and Agri-food Canada (AAFC) as EC’s four main collaborators (Table 2 and Figure 10). As revealed by the survey data in the section on alignment, horizontal science initiatives within the federal government may account for some of these linkages.
Figure 9: Proportion of national bilateral* collaborations by sector (2003–2007).
Source: Scopus data compiled by Science-Metrix (2009).
* Each individual collaboration within a paper is counted as one bilateral collaboration (e.g. a paper co-authored by EC, McGill University and IBM would count as two bilateral collaborations, one with a university and one with a company).
Figure 10: Network of collaborations among S&T branch directorates, EC branches and external national partners (2003–2007). The thickness of the lines represents the number of collaborations (the thinnest lines represent 4 collaborations), and the size of the circles
represents the production of a given branch or directorate. The branches or directorates reflect the organization of the Department in
September 2008.

Source: Figure produced by Science-Metrix, from Scopus data (2009).
Linkages with universities facilitate R&D production
Environment Canada research scientists from the S&T Branch have ties to at least 35 Canadian universities as lecturers, adjunct professors, research associates and visiting scientists. The top four universities for such affiliations are the University of Saskatchewan, the University of Waterloo, the University of Guelph, and the University of New Brunswick. There are also important institutional links through co-location agreements with Carleton University (see Linkages and research excellence through co-locations, below), the University of Saskatchewan, and the University of Victoria, for example. These ties to academia generally result in higher numbers of collaborations, as observed though bibliometric data.
Environment Canada scientists currently supervise at least 230 graduate students and post-doctoral researchers at universities across Canada and at a handful of universities around the world. Graduate students and postdoctoral researchers play an instrumental role in carrying out departmental research projects, helping with a range of research activities from performing field work (data collection) to laboratory analysis. Supervising students and postdoctoral researchers is also an important part of EC’s role as a key player in the research community, directly contributing to the development of a new generation of Canadian scientists.
| Top 10 National Collaborating Institutions | Number of Co-authored Publications |
|---|---|
| University of Toronto | 176 |
| Carleton University | 173 |
| University of Saskatchewan | 171 |
| Department of Fisheries and Oceans | 165 |
| University of Waterloo | 122 |
| University of Guelph | 108 |
| University of British Columbia | 107 |
| University of Victoria | 105 |
| McGill University | 104 |
| Simon Fraser University | 90 |
Strong R&D linkages exist between different branches of the Department
In addition to highlighting the important connections developed for aligning departmental R&D under the Results Management Structure (see section on alignment), bibliometric data allows the identification of numerous scientific collaborations involving members of different branches of the Department (Figure 10). Not surprisingly, there are numerous collaborations (jointly authored publications) between the Atmospheric Science and Technology Directorate (ASTD) and the Meteorological Service of Canada (MSC), and between Wildlife and Landscape Science Directorate (WLSD) and the Canadian Wildlife Service (CWS). Based on this bibliometric data, there is also a great deal of collaboration within the S&T Branch itself—particularly involving scientists from Water, Science and Technology Directorate (WSTD) and either ASTD or WLSD.
Linkages and research excellence through co-locations
The National Wildlife Research Centre (NWRC) is the focal point for Environment Canada’s knowledge and expertise regarding impacts of toxic substances on wild plants and animals, international migratory bird research and population surveys, and the health of wild species as an indicator of environmental quality. The Centre has been located on the Carleton University campus since 2002, a move that consolidated the Department’s wildlife, landscape, and toxicology analytical and research capacities into one national centre.
The co-location of the NWRC has yielded significant benefits for EC. Several of the Centre’s researchers have adjunct faculty appointments with Carleton’s Department of Biology and are actively involved in the supervision of students who are undertaking research at the NWRC. Since the co-location, there has been a significant increase in the number of co-authored papers between EC and Carleton University scientists. EC scientists at the Centre have also benefited from increased access to new facilities and services, especially the Carleton Library and e-journal network.
“Research is increasingly done in teams across nearly all fields. Teams typically produce more frequently cited research than individuals do, and this advantage has been increasing over time. Teams now also produce the exceptionally high-impact research, even where that distinction was once the domain of solo authors”6.
Environment Canada relies on its linkages with other R&D-performing institutions to leverage valuable R&D expertise both nationally and internationally, building capacity in key scientific areas and extending the reach and visibility of its research. EC is linked to these other organizations through joint research projects, co-locations, the supervision of graduate students and post-doctoral researchers, and adjunct faculty appointments at universities.
There are many benefits to linkages. Collaborations, for instance, greatly increase the impact of R&D performed by Environment Canada. Scientific papers written by EC authors with an external collaborator are much more likely to be cited than those with only EC authors, especially if the collaborator works in another country.
Most of Environment Canada’s national R&D collaborations are with universities. Given that universities are major performers of R&D in Canada, strong linkages with this sector are to be expected. Linkages with universities facilitate R&D production and provide EC with valuable research capacity.
Internationally, Environment Canada has strong R&D linkages with a number of countries, most notably the United States. EC performs R&D in collaboration with U.S. federal institutions such as the National Oceanic and Atmospheric Administration (NOAA), the National Aeronautics and Space Administration (NASA), and the U.S. Geological Survey (USGS), as well as a number of prominent American universities.
Strong R&D linkages also exist between different branches of Environment Canada and among directorates of the S&T Branch, which have their own distinct areas of scientific specialization.
The next section examines the excellence of the R&D performed by Environment Canada. It builds on the discussion of linkages to provide further insight into the quality of EC’s highly-connected R&D.
In the context of federal R&D, excellence refers to a combination of high quality and relevance in scientific work. Excellence in R&D output can be measured in terms of scientific impact, production and specialized research capacity.
Excellence implies consistently producing research that, according to one’s peers, is of a high standard and makes an important contribution to the field of study in question. Environment Canada is a proven national and international leader in the field of environmental science7. In the previous sections, it was shown that many areas of the public and private sectors draw upon the Department’s R&D, and that EC scientists are strongly connected to the broader scientific community. This section examines the quality and quantity of EC’s scientific production, in addition to EC’s areas of specialization, as measures of R&D excellence.
A particularly useful tool for measuring R&D excellence is bibliometrics, as it provides reliable data (on an aggregate level) of both production (quantity) and scientific impact (quality). Bibliometric indicators such as the average of relative citations8 (ARC) and the number of papers published, for example, have been shown to consistently and accurately gauge R&D outputs. Bibliometric data is also used in this section to focus on key areas of the environmental sciences, the discipline in which Environment Canada performs most of its research. This section relies on a classification of peer-reviewed journals developed by the Observatoire des Sciences et des Technologies and Science-Metrix as distinct specialties within the environmental sciences: climate, meteorology and atmospheric sciences; ecology and biological resources; environmental engineering, chemistry and biotechnology; environmental planning, management and conservation; environmental sciences – general; pollution, environmental toxicology and health; and water resources.
Bibliometric analysis provides most of the necessary information to evaluate overall research quality. It is complemented by information on the international and national scientific activities of researchers in the S&T Branch, as well as by some examples of particularly high-impact research performed by Environment Canada.
“The quality of S&T should be readily demonstrable to all stakeholders, including the scientific community and the public.”
In the Service of Canadians: A Framework for Federal Science and Technology (2005)
Figure 11: Average of relative citations (ARC) for the Department, by branch and by directorate, according to area
of specialization (2003–2007). Only branches or directorates with a statistically significant number of articles in a given
area are shown. The dotted line represents the world ARC.

Source: Scopus data compiled by Science-Metrix (2009).
In the field of environmental science, EC’s publications have a scientific impact that is well above the world average
Articles written by Environment Canada scientists are cited 40% more than the world average, whereas Canadian publications in the field are cited 10% more often. Figure 11 shows the ARC broken down by specialization and by EC branches or directorates. An ARC of 2, for example, means that the publications are cited twice as often as the average paper in a given area. The ARC has shown a very slight decrease in 2006 and 2007, but given the lack of citation data for these two years, it is too early to tell whether this is a true decline. Monitoring changes in the ARC over the coming years is required to identify any new trends in the impact of EC’s publications.
EC’s top-cited articles span many areas of environmental research
Scientists in the Department have published many highly cited articles on topics including brominated contaminants in wildlife, bird migration patterns, and air quality in the Lower Fraser Valley. As judged by researchers around the world, these R&D publications are highly influential and address many pressing issues in the field of environmental science (see Making an impact, below, for two examples). The list of top-cited papers includes work from all major research areas of the Department. Much of this top-tier research appears to go beyond narrow scientific specializations, achieving a very broad impact that includes, among other things, the development of environmental policies and regulations.
EC’s impact is highest in generalist and interdisciplinary environmental science journals
Environment Canada’s R&D appears to have performed particularly well in the fields of environmental sciences – general (an area that includes many broad-based, interdisciplinary environmental science journals); pollution and toxicology; climate, meteorology and atmospheric sciences; and ecology and biological resources (see Figure 11). In fact, EC’s publications have a higher-than-average impact in all fields except for environmental planning, management and conservation. In this case, a low ARC may be due to the fact that EC is only beginning to develop its capacity in this area. The Department’s production in environmental planning, management and conservation has greatly expanded in recent years though is still proportionally very small, while the impact of the journals where EC publishes seems to have decreased9.
EC’s share of Canadian papers in environmental research recently decreased
Environment Canada scientists currently publish around 600 peer-reviewed articles per year (Figure 12). There has been no significant increase in these numbers during the 2003–2007 period, in contrast to the upward trends that were observed beginning in the late 1990s, for example10. In Canada, production in the field of environmental science has increased by approximately 15% between 2003 and 2007. Therefore, while EC’s research continues to be of the highest quality, its share of environmental science publications in Canada decreased from 15.4% to 12.5% over the past five years.
Figure 12: EC’s R&D production between 2003 and 2007.
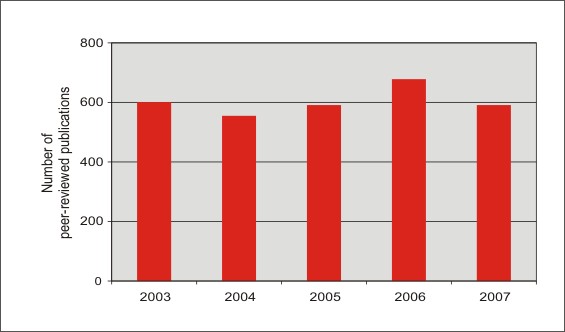
Source: Scopus data compiled by Science-Metrix (2009).
Measuring excellence in the 2006 report, 25 Years of Canadian Environmental
Research
In 2006, Science-Metrix was commissioned by EC to perform a complete bibliometric study of
the state of environmental research in Canada. This report forms the basis of what is known about
national efforts in this area, as well as the quality of research performed at Environment Canada relative
to other institutions.
Canada’s position in environmental research relative to other countries is very strong. Canada ranks third in the world in the number of environmental research papers published, second if considered in per capita terms. Specifically, Canada was found to consistently rank first in the field of ecology and biological resources. Environment Canada is the top Canadian institution among the 50 most productive institutions in environmental research in the world, ranking seventh—after five U.S. federal institutions and the University of Washington. Specifically, EC ranked first in the country in four specialties between 1995 and 2004: climate, meteorology and atmospheric science; pollution, environmental toxicology and health; environmental sciences – general, and water resources.
EC performs R&D across most areas of the environmental sciences
Environment Canada is actively publishing in most areas of environmental research (Figure 13). This distribution of specialties has remained fairly constant over the period studied (2003–2007). The two areas where EC is most prolific are climate, meteorology and atmospheric sciences, and ecology and biological resources. EC’s publications account for almost 40% of all papers produced in Canada in the area of climate, meteorology and atmospheric sciences.
Figure 13: Share of EC’s scientific publications by speciality.
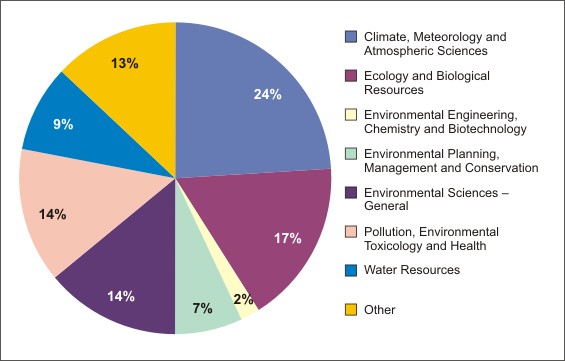
Source: Scopus data compiled by Science-Metrix (2009).
Relative to other institutions, EC’s R&D is most specialized in the field of climate, meteorology and atmospheric sciences
Within the environmental sciences, EC’s scientific output is greatest (relative to the world average) in three areas. EC’s specialization index11 in climate, meteorology and atmospheric sciences is 49.8, followed by pollution, environmental toxicology and health (31.4) and general environmental sciences (29.4). This means that EC is almost 50 times more specialized than the world average in the atmospheric sciences, for instance. In other words, a very high proportion of its papers are published in this particular field. Having well-identified R&D specialties is important for EC’s ability to build strategically upon its research capacity, and provides the robust foundation required to develop new areas of expertise.
EC’s scientists are recognized nationally and internationally
In 2007–2008, more than 50 international and at least 18 national awards were given to S&T Branch employees. National awards included recognition from universities or scientific societies for outstanding research in such diverse fields as ornithology, meteorology and hydrology. Two prime examples are the Chemical Institute of Canada's Norman and Marion Bright Award for contributions to chemical technology in Canada, and an Award of Excellence for the use of GIS from software manufacturer ESRI Canada. International recognition has included many prestigious awards from the American Meteorological Association, for instance. In addition, many EC researchers shared the 2007 Nobel Peace Prize with close to 2000 scientists from around the world for their contributions to the Intergovernmental Panel on Climate Change.
S&T Branch scientists are on the editorial boards of at least 60 different scientific journals
EC’s credibility in the international scientific community is enhanced through its service on editorial boards. S&T Branch research scientists are editors or members of editorial boards of at least 60 international scientific journals, and are sometimes editors-in-chief. Given the importance of the peer-review process, these positions recognize the quality of a scientist’s work in a particular field. The journals in question span the various specialties of environmental science, and include many high-impact titles such as the Monthly Weather Review of the American Meteorological Society and Environmental Pollution. Naturally, EC scientists play an especially important role in many journals based in Canada, such as the Water Quality Research Journal of Canada, and publications with a regional focus, such as the Journal of Great Lakes Research.
Making an impact: EC publications that push the boundaries of scientific knowledge
In July 2007, Xuebin Zhang and Francis Zwiers of the Atmospheric Science and Technology Directorate (S&T Branch) published an article on climate change impacts in the prestigious journal Nature.The paper received over 40 citations in the first 18 months following its publication. The researchers demonstrated how climate change caused by human activities is affecting precipitation on a global scale. In collaboration with top researchers from the UK, the USA and Japan, and using sophisticated climate models, they showed how different latitudes have been experiencing either increases or decreases in precipitation. Detecting changes in large-scale precipitation and attributing them to human activity represents a key step forward in climate research.
Since its publication in PLoS Biology in October of 2004, an important paper by Charles Francis of the Canadian Wildlife Service (at the National Wildlife Research Centre in Ottawa) and others has already been cited over 200 times. This publication represents a major breakthrough in the identification of birds through a small part of their DNA sequence. Focusing their efforts on North American birds, the authors demonstrated the effectiveness of this new method and identified four probable new bird species. In a few short years, this new approach has become widely used within the scientific community.
To assess the excellence of the Department’s R&D output, three main elements of performance were analysed: scientific impact, production, and research capacity.
EC’s R&D publications are highly visible in the wider scientific community. Overall, EC’s publications are cited 40% more often than the world average in the field of environmental science. This is particularly true in broad-based environmental science journals. EC has published highly-cited articles in various environmental science specialties. Many EC scientists are leaders in the field of environmental science, having received high-profile national and international awards and serving on editorial boards of prominent scientific journals.
EC’s R&D productivity is strong and stable in most major areas of environmental science. However, there has been a flattening-out of EC’s production of scientific articles over the 2003–2007 period in contrast to the noticeable upward trend in its publications in the 1990s.
EC’s R&D spans a broad range of environmental research topics. There are, however, a number of areas where it is especially strong and specialized. The most specialized area of R&D in the Department is climate, meteorology and atmospheric sciences. In this area, EC is the top national producer, accounting for 40% of national output.
EC’s ability to increase the quality and quantity of its R&D output is highly dependent on adequate support for research activities. The following section assesses the quality of the enabling environment that supports EC’s R&D.
Well-aligned, well-connected and excellent R&D depends on a strong enabling environment, which includes financial resources, world-class infrastructure, highly-skilled people and strong leadership.
World-class research facilities and equipment not only enable EC scientists to perform high-quality R&D, but also help maintain public trust in EC’s scientific work, as well as facilitate national and international collaborations.
In contrast to earlier sections of this report, which focused on measuring EC’s R&D outputs, scientific impacts or processes, this section focuses largely on R&D inputs. The inputs described in this section are readily measurable elements such as levels of financial and human resources, as well as R&D management initiatives.
In order to have a strong enabling environment for R&D, focusing efforts on one particular input is not sufficient: several elements must work in concert. For instance, funding and infrastructure for R&D are of little use without appropriate numbers of highly qualified personnel, as well as technical and support staff. There must also be management systems in place to ensure that R&D is of the highest quality and continually aligned with the priorities of EC and the federal government.
There is no single metric that can be used to evaluate the conditions for producing good R&D. Consequently, a combination of indicators—including government statistics, bibliometric data and internal human resources information—are used in this section to assess the enabling environment. This collection of measures, with a strong focus on R&D data from Statistics Canada, is complemented by short examples of EC initiatives related to the enabling environment.
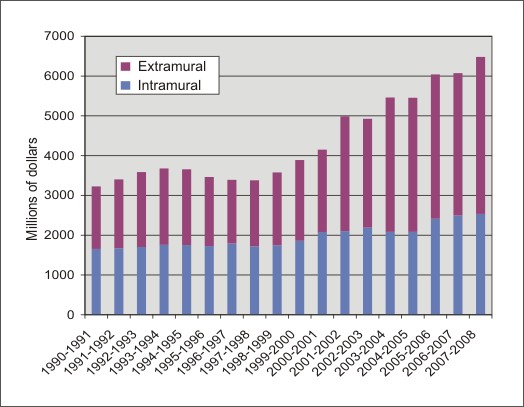
Figure 14: R&D spending at EC (current dollars).

Source: Statistics Canada.
Funding for intramural R&D at EC has remained relatively constant in recent years
R&D accounts for about 25% of EC’s total spending. Overall funding for intramural R&D at EC has been relatively stable, with larger variations occurring in extramural spending (Figure 14). Note that the fluctuations in extramural spending are mostly accounted for by large one-time payments made through EC. For instance, $50 million was provided to Sustainable Development Technology Canada (SDTC) in 2000–2001. Over longer time scales, however, the late 1990s saw a marked decrease in intramural R&D spending, followed by an increase from 1999 to 2003. Since then, intramural spending has generally remained constant at just under $200 million, excluding a slight jump in 2005–2006. The same overall trend can be seen in recent federal R&D intramural expenditures (Figure 15), which have not undergone the same rapid increase as extramural expenditures. Note that the figures reported here are not adjusted for inflation.
Figure 15: Federal R&D spending (current dollars).
Source: Statistics Canada.
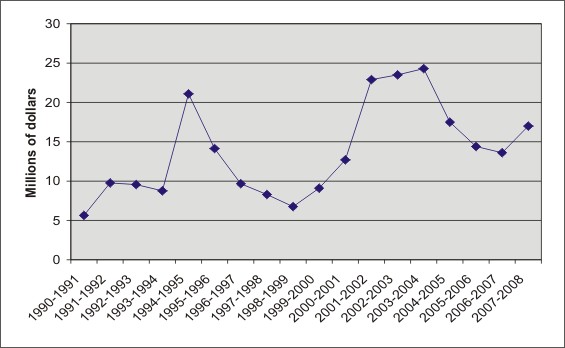
EC’s R&D infrastructure spending is currently increasing, following several years of decline
EC’s capital expenditures (facilities, laboratory equipment, etc.) have fallen between 2003 and 2007 (Figure 16), as is the case overall for federal R&D. This type of funding has been subject to large, cyclical variations over the last twenty years. The most recent data indicates that investment in EC’s R&D infrastructure is now growing. In addition, the 2009 Economic Action Plan provides $250 million over the next two years for the modernization of federal laboratories.
Figure 16: R&D Capital Expenditures at EC (current dollars).
Source: Statistics Canada.
All EC environmental testing laboratories are certified by the Canadian Association for Laboratory Accreditation (CALA)
All nine EC laboratories involved in environmental testing are now certified under the CALA (formerly CAEAL) accreditation program for environmental laboratories. This certification confirms that all of the Department’s facilities involved in environmental testing fulfil the requirements of ISO/IEC 17025, which sets out specific requirements for testing and calibration laboratories, regardless of the scope or specific type of tests being conducted. Across the nine laboratories, hundreds of test methods are currently included in the accreditation, covering the biological and chemical testing of many different substances. The River Road Laboratories in Ottawa, for example, have expanded their scope of accreditation to 45 different test methods, compared with only 11 methods in 1997. Other large-scale accreditation initiatives, focusing on quality management systems, are also underway in the WES Board (see Quality Management Systems and R&D, below).
Quality Management Systems and R&D
The Weather and Environmental Services (WES) Board has registered 36 OPs (almost all programs under the board) to the ISO 9001:2000 standard, which is internationally recognized as a gold standard for quality management systems (QMS), with a particular focus on customer satisfaction and continuous improvement. It is currently the leading standard worldwide for national meteorological and hydrological service providers.
This certification is important for the production and dissemination of departmental R&D under the WES Board, which includes programs related to atmospheric research as well as meteorological and hydrological monitoring. Furthermore, OPs related to information management and information technology, key elements for ensuring high-quality production and effective use of R&D, have also been ISO certified. As a means of standardization, this process has very important implications for developing more effective partnerships and collaborations between different groups within the Department (see section on Alignment and, particularly, Figure 4).
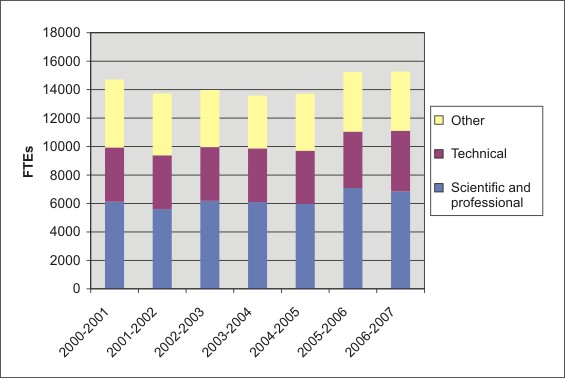
The number of EC R&D personnel has been steadily increasing
The number of personnel working in R&D increased by 20% from 2000 to 2007 (Figure 17). This is expressed as the number of full-time equivalents (FTEs), a measure of the time actually devoted to the conduct of R&D activities. It includes not only researchers, but also technical personnel and other staff playing a supporting role for R&D activities. In the federal government as a whole, however, the number of R&D personnel increased very little between 2000 and 2007 (Figure 18). In addition, it is apparent that, on average, the proportion of scientific and professional employees working in R&D is much higher at EC than for the federal government as a whole (figures 17 and 18).
Figure 17: R&D Personnel at EC. Note that the data for 2006-2007 are estimates only.
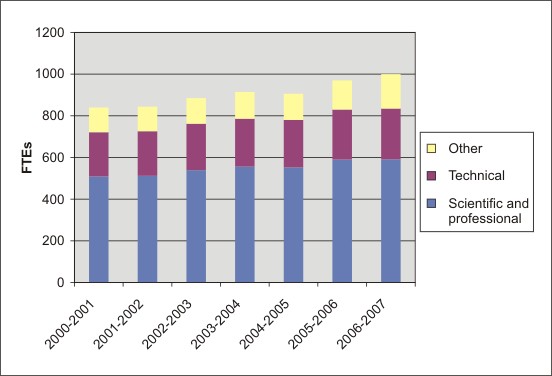
Figure 18: R&D Personnel in the Federal Government. Note that the data for 2006-2007 are estimates only.
Source: Statistics Canada.
Research scientists at EC play a central role in the production of R&D
Members of the “research scientist” occupational group are among the authors or co-authors of almost two-thirds of the Department’s peer-reviewed publications. This figure has remained constant over several years. Research scientists also work with biologists, physical scientists, engineers, chemists and meteorologists to produce R&D in support of all major program areas in the Department.
EC is also building capacity among its research scientists through programs such as Scientists Emeritus, which honours deserving scientists at the end of their careers and fosters the transfer of knowledge to junior scientists through collaboration and mentoring. In the last two years, the number of new scientist emeritus appointments has shown a marked increase.
Building a Strong S&T Workforce: Scientists as Leaders and Becoming Leaders Initiatives
In 2007, the Federal Science and Technology Community launched the Scientists as Leaders pilot program to develop leadership skills and capacity among S&T professionals across the science-based departments and agencies (SBDAs). The program provides leadership-development training to high-performing members of the S&T community workforce to prepare them to compete successfully for EX appointments. Half of the “seats” in the program are dedicated to designated employment equity group members (i.e. women, First Nations people, persons with disabilities and visible minorities). EC has been actively involved in the program: four EC scientists are currently in the program and three have graduated.
A second initiative, Becoming Leaders, is a one-day leadership development workshop for women working in federal science and technology. The workshop focuses on optimizing individual leadership potential and building awareness of factors that influence career success. The workshop seeks to address the under-representation of women in the federal S&T community, particularly at senior levels. Demand for the workshop has been strong: of the 13 participating departments and agencies, EC has had the second-highest number of registrants for the workshop. EC hosted three of the seven workshops offered in 2008–2009.
Risk Assessment in the Great Lakes: The Sediment Quality Index
Cleaning up contaminated sediment is critical to improving water quality—a major concern to Canadians—but cleanup is costly and technologically challenging. Contaminants accumulate in the sediments of lakes and rivers and are a continuing threat to other parts of the environment. Environmental program managers and decision-makers need a means for identifying the highest-risk areas in order to focus cleanup efforts and make the best use of existing resources to benefit the environment.
Environment Canada has developed a sediment quality index (SQI) to help assess the risks of persistent, bioaccumulative and toxic substances in the aquatic environment. Previously, the sheer quantity and complexity of sediment data made it difficult to communicate trends in sediment quality to managers, governments and the public. This tool allows scientists to interpret and communicate sediment quality data to stakeholders, and provides a tool for ranking sediments in relation to urgency for action to protect aquatic biota and wildlife.
The SQI translates large and complex sediment data into a simple index based on three elements:
Sediment quality assessments based on the SQI help identify those sites where cleanup should be a priority to prevent extensive food-web contamination. The key benefit for Canadians is that financial resources can be directed to sites where cleanup and restoration will provide maximum environmental and economic payoff for waterfront areas.
Communicating the results of sediment quality studies can be confusing due to the numerous chemicals typically involved. The SQI provides a practical method of summarizing complex quality data, making it easier to communicate it to decision-makers and the general public, who benefit from increased understanding of the risks to their water quality and the options and opportunities for sediment cleanup12.
The level and quality of inputs that are provided to R&D are variable. Despite no large increases in R&D spending in recent years, and following a period of relatively low infrastructure investment, EC’s R&D personnel have continued to grow steadily and infrastructure investments are expected to rise as result of the 2009 Economic Action Plan. Furthermore, as has been shown elsewhere in this report, EC has been engaging many partners to leverage resources and maximize its research capacities.
Research scientists play a central role in the R&D enterprise at EC, as demonstrated by their high number of scientific publications. Recent successes in various initiatives related to this occupational group ensure continuity and capacity development among researchers.
EC has demonstrated that quality R&D must be well managed and comply with internationally recognized standards. Making this a departmental priority ensures better control over R&D products, promotes public trust in EC’s science, and facilitates internal and external collaborations.
ALIGNMENT
LINKAGES
EXCELLENCE
ENABLING ENVIRONNEMENT
Endnotes
1. Environment Canada’s Science Plan: A Strategy for Environment Canada’s Science. Environment Canada, Government of Canada, Ottawa, 2007 (available at http://www.ec.gc.ca/scitech/default.asp?lang=En&n=9FA49B9A-1).
2. Mobilizing Science and Technology to Canada’s Advantage. Industry Canada, Government of Canada, Ottawa, 2007 (available at http://www.ic.gc.ca/eic/site/ic1.nsf/eng/h_00856.html).
3. In the Service of Canadians: A Framework for Federal Science and Technology. Industry Canada, Government of Canada, Ottawa, 2005 (available at http://www.collectionscanada.gc.ca/webarchives/20071115004814/
http://www.innovation.gc.ca/gol/innovation/site.nsf/en/in05270.html).
4. This example is based on S&T into Action to Benefit Canadians, a series of short case studies on how S&T has influenced environmental decisions (http://www.ec.gc.ca/scitech/default.asp?lang=En&n=4B40916E-1)
5. 25 Years of Canadian Environmental Research: A Scientometric Analysis (1980-2004). Science-Metrix, 2006.
6. Wutchy, S., B.F. Jones, and B. Uzzi. 2007. The increasing dominance of teams in the production of knowledge. Science Vol. 316, p. 1036.
7. 25 Years of Canadian Environmental Research (see note 5).
8. The average of relative citations (ARC) is an indicator of the scientific impact of papers produced by an entity, based on the number of citations it receives. In order to account for different citation practices in different scientific fields, all citation counts are normalized by the average citations received by other articles in a given field.
9. The average relative impact factor (ARIF, a measure of the impact of journals where EC publishes) was higher in the area of environmental planning, management and conservation during the 1995–2004 period (1.1) than the 2003–2007 period (0.8), though only 130 papers were produced (compared with 201 between 2003 and 2007). See note 5 for further information.
10. Ibid.
11. The specialization index indicates the intensity of research of a given entity (e.g. an institution or branch) in a given research area, relative to the intensity of the reference entity (e.g. the world) in the same research area. An index value greater than 1 means that the entity in question is relatively specialized in a certain research area.
12. See note 4.