Environment Canada
July 2011
Previous page | Table of Contents | Next page
Total greenhouse gas emissions in Canada in 2005 were 731 megatonnes of carbon dioxide equivalent6.
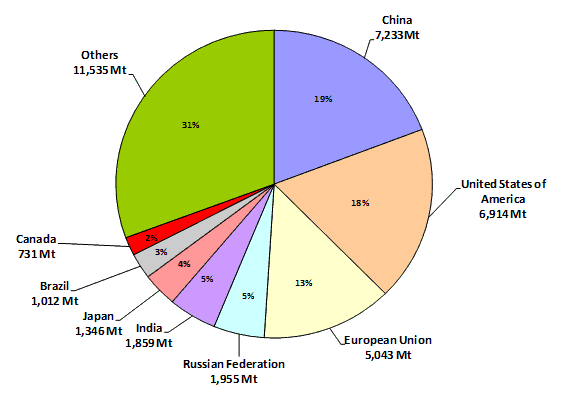
According to the World Resources Institute’s 2005 analysis of reported gross greenhouse gases by country of origin, Canada accounts for less than 2 per cent of total global emissions.
Figure 1 Global GHG Emissions by Country (2005 Mt CO2e) 7

Canada’s share of total global emissions, like that of other developed countries, is expected to decline in the face of the expected rapid emissions growth from developing countries, particularly China and India. According to World Resources Institute data, China overtook the US as the largest GHG emitter by 2005, while the U.S. Energy Information Administration expects that by 2020 China alone will be responsible for 27% of total global emissions, up from about 20% in 2005.8
When Canada signed the Copenhagen Accord in December 2009, it committed to reducing its GHG emissions to 17 per cent below 2005 levels (or 607 Mt) by 2020. That is the same reduction target set by the United States.
As a signatory to the Copenhagen Accord, Canada is a member of a group of 140 countries that together are responsible for 85 per cent of global emissions. The Accord was signed by China, the U.S., Brazil and India, which together account for over 40 per cent of global emissions. In contrast, none of these major emitters had commitments under the Kyoto Protocol, an agreement that involved commitments of only 40 nations representing 27 per cent of global emissions.
6 Often greenhouse gas emissions are calculated in terms of how much CO2 would be required to produce a similar warming effect. This is called the carbon dioxide equivalent (CO2e) value and is calculated by multiplying the amount of the gas by its associated global warming potential (GWP). Source: National Inventory Report.
7 “Climate Analysis Indicators Tool (CAIT) Version 7.0” (Washington, D.C.: World Resources Institute, 2010).
8 US Energy Information Administration IEO2010 Reference case http://www.eia.doe.gov/oiaf/ieo/emissions.html