The analytical findings present the general cost of the policy change to the economy as a whole and its key players (major economic sectors, including consumers). The analysis also captures some of the benefits of taking action. For instance, one benefit that results from the policy is the energy savings that result from investments in energy efficiency. However, there are benefits of taking action that are not included in this analysis, such as the environmental improvements (e.g. cleaner air) and associated health benefits, or the benefits of technological innovation, which are however unlikely to materialize in this short period. Therefore, this analysis provides a partial view of the consequences of the core scenario considered to meet Canada's Kyoto target.
This analysis is based on an integrated energy- technology and macroeconomic model. While a very sophisticated analytical tool, no modeling structure can fully capture the complicated interactions between and within markets, and between firms and consumers associated with a given policy shock. However, this and other models can provide directional guidance with respect to the broad economic consequences likely to arise from a policy change, based on the best information available, and within the constraints of the assumptions applied. Several variations of models exist, and have different strengths and weaknesses.
The specific modeling framework used for this analysis has several known limitations. Its strength is in modeling impacts at the national level. Sectoral and regional distributions of these impacts require careful refinement and interpretation. Furthermore, results are generated at the industry level - there is no capacity to assess impacts on individual firms.
A further limitation derives from the fact that the modeling framework used in this analysis was not calibrated to simulate the effects of a monetary policy and exchange rate response to the economic impacts of the policy. Such a response - particularly the exchange rate - would be expected to help temper the shock and facilitate economic recovery over time. This means that the economic impacts presented may be somewhat overstated, particularly after 2009, assuming that a monetary policy and exchange rate response could accelerate economic recovery without at the same time increasing Canadian emissions in excess of the Kyoto target. The results presented here should therefore be interpreted as how the economy would initially be affected by a full-blown implementation of Kyoto over the short term, not how and when the economy would eventually recover from the shock.
Unless otherwise noted, the impact of the policy on key economic indicators is presented in per cent deviation from the business-as-usual scenario. Business- as-usual (BAU) refers to the scenario associated with continuing current population, economic and technology trends and in the absence of government policy to reduce GHG emissions.
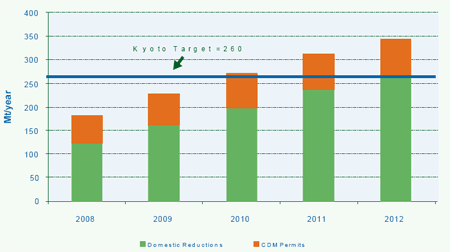
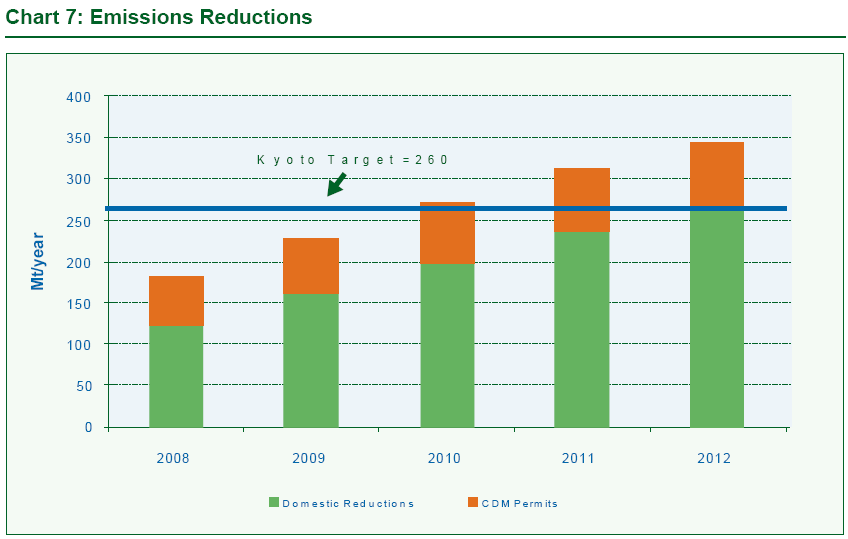
Chart 7 illustrates the mix of domestic and international credit contributions to Canada's emissions reductions over the Kyoto period under the policy scenario. About 25% (65 Mt) of Canada's annual target of 260 Mt is accounted for by international purchases each year. Domestic reductions would increase over the period as businesses and individuals react to higher energy prices. In this period, some small domestic reductions would come from carbon sequestration, landfill gas and enhanced agricultural methods, but as will be demonstrated below, a significant share of domestic reductions would come from reductions in sector outputs associated with the carbon tax shock.
Chart 7: Emissions Reductions
While credit purchases would decline as a share of total reductions over time, they amount to about $1.8 billion in yearly expenditure for reducing emissions in other countries.
The domestic carbon tax would generate on average $105 billion per year in revenue, most of which is assumed to be recycled in the form of reduced business and personal tax burdens.13 The tax reductions mitigate the impact of the carbon tax on domestic demand in the short term. They also increase economic efficiency over the long term by stimulating, for example, capital accumulation; however, these effects are not materially important for the short run.
![]()
The gross domestic product (GDP) is the best available indicator of the overall health of Canada's economy, as it measures the market value of all the goods and services produced in the Canadian economy (or the total value added by all sectors of the economy).
The analysis indicates that GDP would decline by more than 6.5% relative to current projections in 2008 as a result of the policy, falling to a level about 4.2% below that of 2007 (Table 1). This would imply a deep recession in 2008, with a one-year net loss of national economic activity in the range of $51 billion relative to 2007 levels. By way of comparison, the most severe recession in the post World War II period for Canada, as measured by the fall in real GDP, was in 1981-1982. Real GDP fell 4.9% between the second quarter of 1981 and the fourth quarter of 1982.
Following 2008, GDP would resume growth, but under this simulation would not recover to 2007 levels until about 2010. However, as previously noted, this analysis does not account for a monetary policy and nominal exchange rate response that would be expected to mitigate some of this loss, particularly after 2009. Indeed, after a one-time spike in the price level in 2008 (an increase of about 6%), the results indicate a significant fall in the inflation rate below BAU levels in the following years, as well as a substantial deterioration of Canada's trade balance. Independent of any monetary policy reaction, this would likely trigger a depreciation of the Canadian dollar, helping restore Canada's competitiveness over time. Furthermore, while the monetary policy response in 2008 would be complicated by the presence of a one-time spike in the price level and a depreciating currency, the recession, together with the expectation of inflation returning to levels below the BAU, would in all likelihood lead to a more accommodative monetary policy. The size of the GDP loss, relative to BAU, that could be at least partially offset as a result of such a response is represented by the dashed line in Chart 8. It should be further noted, however, that the need to ensure that Kyoto's emissions targets continue to be met throughout this period would likely require further increases of the carbon tax rate to ensure that the recovering economy does not exceed the Kyoto GHG ceiling.
All provinces and sectors would experience significant declines in economic activities under this scenario. Alberta, because of its high dependence on energy- intensive oil and gas production, would likely be particularly impacted.
| 2008 | 2009 | |
|---|---|---|
| Difference from BAU, per cent | ||
| Real GDP | -6.7 | -7.2 |
| Employment | -2.5 | -4.1 |
| 2008 | 2009 | |
| Estimated Rate of Growth, per cent | ||
| Real GDP | -4.2 | -2.2 |
| Employment | -1.4 | -0.3 |
These negative GDP impacts, despite the recycling of carbon tax revenues, are explained by a number of key factors. First, there would be a significant time lag between recycling of tax revenues and any associated economic rebound effect, as businesses realign capital investments in light of the sudden reality of a carbon-constrained economy, and consumers save, over the short term, a portion of the recycled revenues they receive. Second, there would be "leakage" of the recycled carbon tax out of the Canadian economy associated with the rise in domestic production costs - imports of foreign-produced goods and services would increase, and in conjunction with a significant decline in overall exports, Canada's balance of trade position would deteriorate. Finally, about 30% of carbon tax revenues are retained by federal and provincial governments to offset pressures on their respective fiscal positions arising from the policy shock - this amounts to a net increase in the overall tax burden, with attendant economic costs.
The fall in production means that net employment would be down from the BAU level by more than 4% (or 705,000 jobs) in 2009 as businesses scale back or cease production in response to reduced demand and higher costs (Table 1). This would raise the unemployment rate by about 1.5 percentage points in 2009 (about 25% higher than current projections). The absolute level of employment would fall by about 1.7% (or 276,000 jobs) between 2007 and 2009. The expected fall in employment is less than that in real GDP because the most affected industries - carbon-intensive industries - are more intensive in capital and less in labour compared to other sectors.14 In addition, there would be a reduction of real per capita personal disposable income levels from BAU of around 2.5% in 2009 (or about $1,000 per Canadian in today's dollars).
Chart 8: Impact on GDP Growth
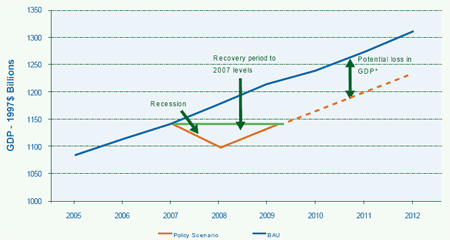
* Does not incorporate likely monetary policy and nominal exchange rate response
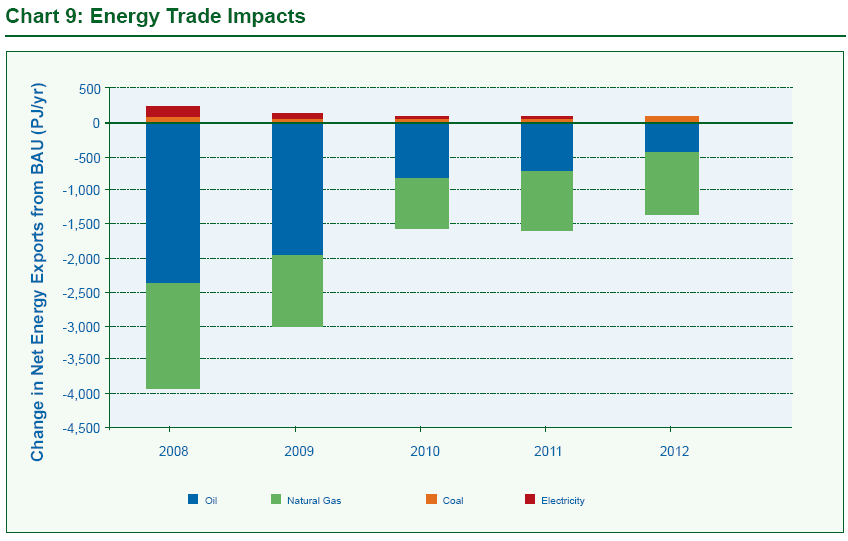
Due to the much higher costs of production associated with the introduction of a major carbon tax on energy inputs, Canadian energy exports would be expected to decline significantly (Chart 9).
Canada's net exports of petroleum products would decline precipitously relative to BAU levels, as higher production prices would render much of our petroleum industry uncompetitive at prevailing world market prices, particularly with respect to energy-intensive oil sands production.
Overall, the analysis indicates that Canada's oil production for both domestic and export markets would be approximately 30% less than in the BAU scenario in 2008.
Chart 9: Energy Trade Impacts
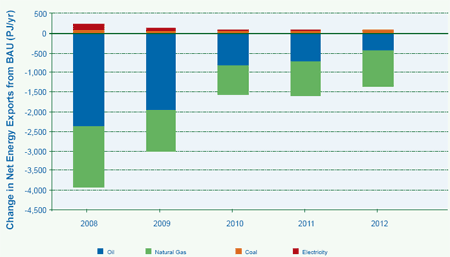
Net exports of natural gas would also fall as a result of cost-driven declines in domestic production of about 15% on average over 2008-2012. Coal imports would be expected to fall by almost 15% on average over the period relative to BAU projections, as the phase-out and closure of existing coal-fired electricity generation facilities is sped up - as a result of relative stability in gross coal exports, net exports of coal would increase slightly.
In terms of net electricity exports, it is likely that they would be somewhat greater as a result of the policy because reduced domestic demand for electricity, associated with broad economic decline, would create an excess supply of "clean" Canadian electricity in hydro-rich provinces (Quebec, Manitoba, B.C.) that could be exported to meet US demand.
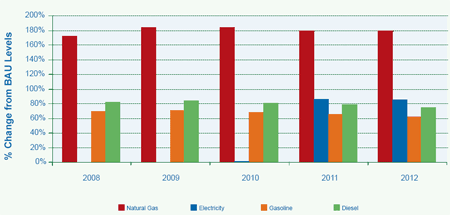
The carbon tax would also have implications for energy prices faced by Canadian consumers (Chart 10). Natural gas prices would more than double in the early years, relative to BAU prices, as a result of the carbon tax. In contrast, national electricity prices would be expected to be relatively stable in the early years as total supply remains roughly in line with the baseline scenario as higher exports compensate for reduced domestic demand (there would, however, likely be significant regional variations in electricity price impacts). In later years, decisions would likely be taken to postpone planned expansions of electricity production capacity, or opt for relatively more expensive sources of electricity generation such as renewables and natural gas, and as a result electricity prices would likely rise by about 50% on average after 2010.
Prices for transportation fuels would also rise by a large margin - roughly 60% higher relative to BAU. At today's gasoline prices of approximately 90 cents a litre, this would translate into an average price of over $1.40 per litre as a result of the policy.
Chart 10: Energy Price Increases
![]()
13 The government keeps some of the revenues to ensure that the total government balance remains in line with projected values in the baseline scenario.
14 As a result, the adverse impact on employment and the unemployment rate is less than experienced in the 1981-1982 recession.
![]()