Top of Page
Previous page | ToC | Next page
A total of 522 facilities reported GHG emissions for the 2009 calendar year, collectively emitting a total of 250 megatonnes (Mt)2 of CO2 eq of GHGs. Facilities falling below the reporting threshold of 50 kt CO2 eq per year can voluntarily report their GHG emissions; 72 facilities did so in 2010. There were 159 facilities reporting their GHG emissions in 2010 for the first time.
The total facility-reported GHG emissions for 2009 represent just over one-third (34%) of Canada's total GHG emissions and just over half (53%) of Canada's industrial GHG emissions3. Where appropriate, the facility-reported emissions data are used by Environment Canada to compare and validate the inventory estimates (developed from national and provincial statistics) in the National GHG Inventory4 produced and submitted annually by Environment Canada to the United Nations Framework Convention on Climate Change.
The data used in this overview report are current as of September 23, 2010. Subsequent company updates will be included in next year’s data release.
Facilities in Alberta accounted for the largest share of reported emissions, with approximately 47% of the total, followed by those in Ontario with 20%. Next were facilities in Saskatchewan and Quebec which accounted for 9% and 8% of reported emissions, respectively (Table 1).
| Province | Number of Facilities | Total Emissions (kt CO2 eq) | % of Total Emissions |
|---|---|---|---|
| Newfoundland and Labrador | 8 | 4 378 | 2% |
| Prince Edward Island | 1 | 74 | 0% |
| Nova Scotia | 12 | 10 773 | 4% |
| New Brunswick | 14 | 10 118 | 4% |
| Quebec | 69 | 20 341 | 8% |
| Ontario | 125 | 49 179 | 20% |
| Manitoba | 12 | 2 132 | 1% |
| Saskatchewan | 31 | 22 428 | 9% |
| Alberta | 160 | 117 358 | 47% |
| British Columbia | 62 | 13 154 | 5% |
| Northwest Territories | 28 | 519 | 0% |
| Totals | 522 | 250 454 | 100% |
When completing the GHG report, a reporter is required to identify the main activities occurring at its facility by selecting the North American Industry Classification System (NAICS)5 code that corresponds to these activities. In 2009, three industrial sectors accounted for the majority of GHG emissions—Utilities, primarily those generating electricity, representing 40%; Manufacturing, accounting for 30%; and Mining, Quarrying, and Oil and Gas Extraction, accounting for 24% (Figure 1). Manufacturing sectors include cement and lime manufacturing; pulp and paper mills; petroleum refineries; chemical manufacturing; and iron, steel and aluminium production facilities. Activities of reporting facilities within Mining, Quarrying, and Oil and Gas Extraction include production of petroleum and natural gas; oil sands mining and bitumen production; and mining of coal, iron ore, other metals, potash and diamond.
Total reported emissions in 2009 = 250 Mt
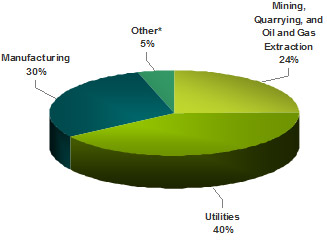
* “Other” includes Transportation and Warehousing, as well as Administrative and Support, Waste Management and Remediation Services industrial sectors
In 2009, 466 of the 522 facilities reporting had GHG emission levels of less than 1 Mt. The remaining 56 facilities emitted GHGs in quantities higher than 1 Mt and accounted for 64% of the total reported emissions6.
2 1 Mt = 1000 kt.
3 In this overview report, Canada's industrial GHG emissions include the following GHG categories from the National Inventory Report 1990-2008: Greenhouse Gas Sources and Sinks in Canada: Stationary Combustion Sources (except Residential), Other Transportation, Fugitive Sources, Industrial Processes and Waste. The facility data coverage is compared to the 2008 National GHG Inventory since the National GHG Inventory which will include complete national emissions data for 2009 will not be available until early 2011.
4 Canada's latest National GHG Inventory - the National Inventory Report 1990-2008: Greenhouse Gas Sources and Sinks in Canada - is available at: www.ec.gc.ca/Publications/default.asp?lang=En&xml=492D914C-2EAB-47AB-A045-C62B2CDACC29
5 The NAICS code is a six-digit code that was developed by Statistics Canada, the U.S. Office of Management and Budget and Mexico's Instituto Nacional de Estadistica Geografia e Informatica to enable the respective national agencies to collect comparable statistical data. The NAICS code in Canada consists of 20 sectors, 102 subsectors, 324 industry groups, 718 industries and 928 national industries.
6 Facility-level data is published on Environment Canada’s Greenhouse Gas Division website at: www.ec.gc.ca/ges-ghg/default.asp?lang=En&n=DF08C7BA-1