Overall, the document review and key informant interviews indicate that there has been notable effort to ensure that the performance measurement data collection and reporting system provides information on key outputs and outcomes, and that these are currently managed through the early PMF development and ISO 9001 Quality Objectives. The main area for improvement at present would appear to be developing comprehensively managed reporting through methods such as an annual report, in order to ensure that the wealth of data are reported in a consistent and unified manner. There is also some room for improvement with respect to the completeness and regional consistency of data and the use of performance data to inform senior management / decision makers.
A review of the evidence found that the SMT SA is able to provide data and targets on its key outputs, and that the SMT SA is performing at or near the vast majority of these targets. With regards to performance against outcomes, evidence of strong performance regarding access to and use of weather and ice information products exists. Data were more limited for the outcomes related to a reduced need for emergency interventions, and reduced unexpected delays by commercial marine transports due to marine weather or ice, but some information was available nonetheless. However, given the recent establishment of the SA and outcomes, no historic data exist to measure the degree to which these outcomes have seen changes over time. Data gathered during this evaluation can be used for future refinement of a PMF and, where appropriate, as a baseline against which future performance can be measured.
The evidence related to efficiency and economy is preliminary, but points toward an SA that is taking steps to ensure that SMT SA inputs are appropriate and costs of outputs are minimized. Areas for improvement and future challenges include clarifying roles and responsibilities with DFO/CCG related to servicing buoys and storm surges, and exploring possible cost savings opportunities associated with a better use of emerging technologies.
| Evaluation Issue: Performance | Indicator(s) | Methods | Rating |
|---|---|---|---|
4. Are appropriate performance data being collected, captured and safeguarded? If so, is this information being used to inform senior management / decision makers? |
|
|
Progress Made; Attention Needed |
Overall, the document review and key informant interviews indicate that there has been notable effort to ensure that the performance measurement data collection and reporting system provides information on key outputs and outcomes, and that these are currently managed through the draft PMF and ISO 9001 Quality Objectives. The SMT SA is able to provide data and targets on its key outputs; and performance data exist, although in a more limited manner, on its identified outcomes. The main area for improvement is developing comprehensively managed reporting in order to ensure that the wealth of data being collected is reported in a consistent and unified manner, so as to inform senior management and decision makers. There is also some room for improvement with respect to the completeness and regional consistency of data.
The SMT SA has many of the key components for the development of an effective PMF, and evidence shows that attention has been given to this area. At a broad level, the evaluation found that the SMT SA has been generally effective at collecting performance measurement data. The level of available data is perhaps not surprising, given that the main program components of the SMT SA have been in place for many years. There are regular performance reports for the CIS, CCG icebreaking, and public and marine warnings, and the CIS/CCG partnership agreement outlines performance measures. Furthermore, there was a PMF under development during the evaluation to specifically address the SMT SA, as well as performance measures established in the Quality Management System (QMS) Manual (as part of the ISO 9001 Quality Objectives),38 and a Marine Forecast Verification Project aimed at improving the quality of marine forecasts and warnings. Details are as follows:
The evaluation found that data are available to some degree for all of the outputs and outcomes identified in the draft PMF43 for the SA and those identified in the evaluation plan.44,45 Most of the performance measures appropriately capture the outcomes that are being measured, although in some cases the data do not align precisely or the periods of coverage are inadequate or have gaps. Table 8 summarizes the data collected against the identified outputs and outcomes.
| Indicators | Data collected | Availability |
|---|---|---|
Output – Ice information products: Percentage of ice charts and forecasts transmitted within 30 minutes of prescribed deadlines |
|
☑ Monthly data |
Percentage of ice warnings issued and verified prior to the event |
|
☒ No data |
Output – Ice information field services: Frequency (percentage of times) that trained ice service specialists are provided as per partnership agreements |
☑ Monthly data |
|
Output – Marine weather information products: Percentage of gale, storm, and hurricane-force warnings issued at least 24 hours in advance of the event |
|
☑ Quarterly data |
Evidence of forecast accuracy |
☑ Quarterly national data and monthly regional data |
|
Outcome – Access to and use of meteorological, oceanographic, and ice information products and services by target users |
|
☑ Survey conducted in 2004, skewed toward recreational mariners53,54 |
|
☑ Annual data55 ☑ Annual data56 |
|
Outcome: Reduced number of emergency interventions (by emergency response teams and/or CCG) due to marine weather or ice |
|
☑ 21 years of annual data are available from the Transportation Safety Board57 |
Outcome – Reduced unexpected delays encountered by commercial marine transports due to marine weather or ice |
|
☑ Annual data58 |
PAA Outcome – Marine communities have the weather, wave and ice information they need to operate safely and efficiently in Canadian waters: Target end-users’ satisfaction with the accuracy, timeliness, accessibility / user-friendliness and usefulness of marine weather and ice information products and services |
|
☑ Data from a 2004 survey59 |
|
☑ 30 regional client engagement sessions in 200760 ☑ Discussions with 80 visitors, and 27 surveys61 ☑ Discussions with 280 visitors, and 59 surveys62 |
The key informant interview responses on the state of performance measurement for the SA generally align with the findings from the review of documents related to performance measurement. Generally, the opinion from key informants was that performance measurement has recently undergone, and is continuing to undergo, substantial improvements. Several individuals indicated that the ISO 9001 Quality Objectives were an important contributor to improvements in performance measurement. The Marine Verification Project was also noted as a contributor to improved quality of performance measurement information, as it collects data on the accuracy of marine weather products to support ongoing improvements.
Though the majority of interviewees suggested that performance measurement data are being used to inform decision‑making processes, no documents were found in the document review that indicated decisions were being made based on collected performance measurement data. During the interviews, however, key informants did provide specific examples, including the following:
Several areas of improvement were noted by key informants:
A 2011 DFO-led evaluation of the CCG’s Icebreaking Program63 noted that CCG management had concerns regarding the level of performance reporting from the CIS. At the time of that evaluation, CCG representatives identified that delayed performance reporting from the CIS limited the extent to which the Icebreaking Program could report to Parliament on the full range of activities and outcomes. However, during this evaluation, CCG representatives noted that the CIS had greatly improved performance reporting in recent months.
| Evaluation Issue: Performance | Indicator(s) | Methods | Rating |
|---|---|---|---|
5. To what extent have intended outcomes been achieved as a result of the program? |
Evidence of / views on achievement of intended outputs and outcomes Outputs:
Outcomes:
Evidence of / views on factors outside the direct purview of the program that may influence / have influenced the achievement of intended outcomes |
Document review Key informant interviews Performance data analysis |
Achieved |
A review of the evidence, including evidence based on activities prior to the formal integration of the weather and ice services under the SMT SA in 2010‑11, found that the SMT SA is performing at or near many of its targets for its key outputs, such as the delivery of ice forecasts, charts and marine weather warnings. Furthermore, the SMT SA appears to be achieving three of the four listed outcomes, including demonstrating access to and use of SMT products and services by key clients. The evaluation evidence also pointed to an impact on the reduction of emergency interventions, though the evidence was indirect. The fourth outcome, related to reduced delays for maritime transportation, may not be feasible to measure at present. Given the recent establishment of the SMT SA and its associated outcomes, no historic data exist to measure the degree to which these outcomes have seen changes over time.
Generally speaking, the SMT SA has been performing at or near the vast majority of established targets for program outputs. More specifically, evidence collected from the SMT SA indicates that forecast bulletins have been meeting their performance targets and that ice charts have been just below the stated target64. Furthermore, the provision of ice service specialists has been consistently meeting the performance target.65
Gale warning lead times, and storm and hurricane‑force warnings, are not yet performing at the targeted level; this is partly corroborated by mariners’ ratings of the timeliness of marine warnings.66 The POD and FAR for storm and hurricane-force warnings have been performing well, while gale force warnings have been somewhat weaker in their performance relative to the stated target.67 More detail regarding these outputs and results is provided in Table 9.
| Data collected | Results |
|---|---|
Ice information products
|
|
Ice information field services
|
|
Marine weather information products
|
|
|
|
At this point, although there was ample quantitative and qualitative evidence to examine each of the proposed indicators, given the lack of historic reporting for the SA the evaluation team was unable to identify changes over time in the indicators that could quantify actual increases.
Outcome 1: Increased access by target clients (OGDs and end-users, both domestic and international) to accurate, timely and user‑friendly weather and ice information products and services
There is a range of evidence suggesting that meteorological, oceanographic and ice information products and services are being accessed by the targeted users. Survey data collected by the MSC indicated that a large majority of mariners use marine weather information, and almost half frequently change their plans based on this information, while two thirds of mariners indicated that they usually followed the recommended ice routes. Mariners are very satisfied with the timeliness, accessibility / user-friendliness and usefulness, but somewhat less satisfied with the accuracy, of marine products. A large majority of participants found weather information products and ice products to be important and that the warning system was meeting their needs.73
Another indicator of access is the number of website hits. In recent years, there have been, on average, over 30 million visits annually to the marine weather portion of the Weatheroffice website and over 1.5 million visits on the Really Simple Syndication feed for marine products.74 Furthermore, surveys indicate that the EC Weatheroffice website is one of the most frequently used sources of marine weather information by mariners. These surveys also indicated that the CCG Continuous Marine Broadcast was another frequently used source of marine weather information.75,76 The CCG obtains its information for the broadcast from EC.
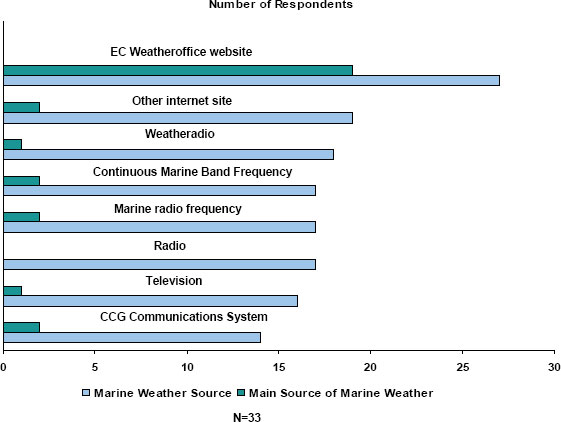
Figure 1 presents the distribution of marine weather sources, based on the survey of end-users. It shows both the general sources of maritime weather information (i.e., all sources accessed by end-users) and the main source of maritime weather information (i.e., the primary source accessed by end-users). These survey findings support the results on access noted above, as 27 of the 33 respondents (82%) indicated that the EC Weatheroffice websiteis one of their sources for marine weather information, and 19 (58%) indicated that the site is their main source of weather information. After the Weatheroffice website, sources such as other Internet sites, Weatheradio, the continuous marine band frequency, the marine radio frequency, radio, television and the CCG’s communications system were all highly cited as sources of weather information. The Weatheroffice website, however, was the most‑cited main source of information.
Figure 1: Distribution of Marine Weather Sources Used by Respondents (text description)
Feedback received from attendees at two marine events attended by EC representatives identified an access issue with Weatheradio broadcasts: attendees remarked that because these broadcasts alternate between separate English and French broadcasts at fixed intervals, longer broadcasts are frequently cut off before completion, as the broadcast must switch to languages at the scheduled time, thus posing a safety risk and limiting the utility of the product for mariners.77,78 The issue of the alternating broadcast was also highlighted by about half of the key informants interviewed (including individuals external to government), by one respondent in the survey of end-users, and through a review of program documents.79
Outcome 2: Increased use of weather and ice information products and services by target clients (OGDs and end-users, both domestic and international) to reduce their risks of operating in a hazardous environment
As with access to marine forecast products, the evaluation team found a range of evidence to suggest that SMT SA products and services are being widely used by the target populations. The majority of key informants (12 of the 18 that provided a numeric ranking) indicated that the program has increased the use of SMT products by end-users to a significant degree. For example, key informants noted the following:
As noted in Figure 1, evidence from the survey of end-users also suggested that SMT SA products are used by targeted stakeholders. The EC Weatheroffice website, radio broadcasts, Weatheradio, and television were frequently identified as SMT SA products used by end-users, and the EC Weatheroffice website was identified as the main source of weather information by a large majority.
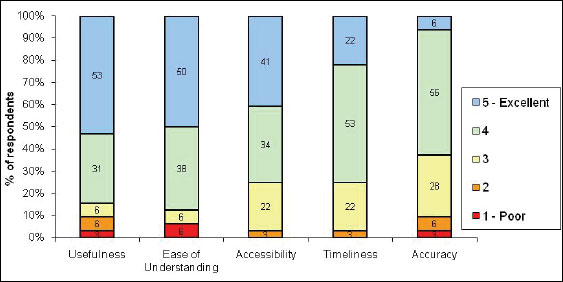
As noted in Figure 2, respondents to the survey of end-users also provided high ratings (using a five‑point scale) on the accessibility, usefulness, ease of understanding, timeliness and accuracy of the weather information that they used. Respondents generally provided a rating of either 4 or 5 for each item. Usefulness and ease of understanding were most likely to be rated 5 (excellent), by 53% and 50% of respondents, respectively. Respondents provided marginally lower ratings on accuracy than the other items, as shown below, with only 6% rating this item as a 5, although nearly 56% provided a rating of 4.
Figure 2: Rating of the Marine Weather Service (text description)
Other sources of evidence, such as the 2004 Marine Weather National Services Survey, also suggest that historically the use of SMT SA products and services has been high. Some findings from the survey:
Outcome 3: Reduced number of emergency interventions (by emergency response teams and/or CCG) due to marine weather or ice
An unqualified assessment of this outcome was not possible, given the difficulty in establishing direct attribution of emergency interventions to SMT programs and activities. Nevertheless, the evaluation team was able to examine evidence from marine investigations of the Transportation Safety Board and key informant interviews that referred to general trends linking weather and ice information to marine safety. From 2005 to 2009, there were 36 marine investigations published by the Transportation Safety Board. Of these reports, most incidents (75%) tended to occur during favourable weather conditions. Of those involving inclement weather or difficult seas, weather reports were accurate and had given sufficient notice to mariners in all but one case, where an inaccurate report was deemed to have increased the risk of an accident.
| Year | Total no. reports | No. incidents where weather/ice conditions were a factor | No. reports where service provided by MSC was accurate | Summary of incident |
|---|---|---|---|---|
| 2009 | 7 | 1 | 1 | Quartering seas |
| 2008 | 7 | 0 | NA | |
| 2007 | 5 | 1 | 1 | Quartering seas |
| 2006 | 12 | 4 | 380 | Squall Quartering seas Hurricane-force winds (as predicted by U.S. Coast Guard) Strong winds81 |
| 2005 | 15 | 3 | 3 | Fog Caught in ice Poor weather |
| Total | 46 | 9 | 8 |
Key informants were generally cautious in addressing this outcome indicator directly, and several respondents did not provide a rating on the degree to which the SMT SA contributed to reducing emergency interventions, noting that the role played by EC is important, but by no means the only factor in reducing the number of emergency interventions.
Of those who provided a view regarding the degree, responses ranged from moderate to significant. A number of examples were provided of how SMT products and services have led to reductions in the number of emergency interventions associated with marine weather or ice, including:
Also, all three key informants from OGDs were generally positive regarding the MSC’s role in providing accurate weather information to assist and support maritime emergency responses.
Outcome 4: Reduced unexpected delays encountered by commercial marine transports due to marine weather or ice
The majority of respondents do not believe that this outcome can be assessed at this point in time, because there are no data available to address the indicator, and it would be difficult to know how weather and ice information could have potentially affected the advanced planning for travel routes. Examples of reductions in unexpected delays that were nonetheless noted by respondents included: revisions to ferry service schedules in the Pacific and Atlantic regions as a result of forecasted information, and a reduced need for ship navigation through ice-bound waters as a result of regional CCG adjustments to shipping routes; these adjustments were based on detailed information provided by the SMT SA. Key informants noted, however, that the MSC plays a limited role in affecting this area of maritime navigation and that, at the very least, this outcome needs to be considered a shared outcome with other parties.
CCG documentation indicates that only a small minority of service delays for clients in 2008-2009 were due to ice conditions (13%) or weather or tide conditions (4%). Once again, though, this information is not adequate to determine whether these delays were anticipated or unexpected, or what role SMT-related products may have had in mitigating their impact.82
Unintended/unanticipated outcomes
Only one unintended outcome of the SMT SA was identified by multiple key informants. This issue related to unforeseen impacts on service delivery as a result of introducing a standardized national approach to the forecast for the Weatheradio broadcasts. Prior to the initiative, which introduced a standardized two‑day forecast on all broadcasts, there had been a three-day forecast included in broadcasts in the Atlantic region, and a one‑day forecast on broadcasts in other parts of the country. The modification to this broadcast schedule in the Atlantic region and the resulting frustration among clientele in the region had been unintended.
External factors affecting the achievement of outcomes
A number of issues were identified by key informants as areas outside of the MSC’s direct control that have, or may have, impacts on the performance of the SMT SA. Approximately one quarter of the key informants pointed to the risks of relying on other collaborating organizations for funding and service delivery. For example, it was noted that EC is increasingly relying on external organizations for the provision of satellite monitoring data, which have become an important source of meteorological information. Furthermore, SMT SA services could be greatly reduced, at least in the short term, if an existing collaborating organization (CCG being the most frequently cited) were to undergo budget cuts or a change in business model. Another cited example was the fact that EC relies on CCG for transportation when servicing weather buoys, and there have been instances where this has resulted in several months passing without service for a particular buoy, thereby resulting in a loss of monitoring data.
| Evaluation Issue: Performance | Indicator(s) | Methods | Rating |
|---|---|---|---|
6. Are Services to Marine Transportation achieving their intended outcomes in the most economical manner? |
|
|
Progress Made; Attention Needed |
Generally, the SMT SA appears to be managing its resource inputs in an economical way, including reallocating resources from existing areas to address new initiatives, as was the case with METAREAs Initiative funding for 2010-11. Additionally, effective governance and priority-setting mechanisms have been established. There are, however, some areas where further clarification of roles and responsibilities may be beneficial, particularly regarding certain responsibilities between EC and DFO related to marine weather issues for buoy maintenance and storm surges.
The numbers in Table 11 represent expenditures for the SMT SA for the last four fiscal years. The budgets at the start of each fiscal year were not available from the Department, thus precluding an analysis of budgeted versus actual expenditures; however, the Evaluation Division was informed by the Financial Services Division that this SA tends to manage its budget very closely and that actual expenditures essentially equate to the total budget for the program. As noted previously, the METAREAs Initiative is outside the scope of the evaluation as it is too new to evaluate, but expenditures for METAREAs have been included in Table 11, in order to provide a complete picture for the 2.2.2 PAA element (the SMT SA).
| 2007-08 | 2008-09 | ||||||
|---|---|---|---|---|---|---|---|
| Marine | Ice | Total | Marine | Ice | Total | ||
| FTEs | 31 | 95 | 126 | 32 | 108 | 140 | |
| Salary | 2,386 | 2,861 | 5,247 | 2,639 | 2,771 | 5,410 | |
| O&M | 184 | 2,119 | 2,302 | 212 | 2,634 | 2,846 | |
| Capital | 0 | 77 | 77 | 0 | 337 | 337 | |
| VNR-Salary | 1 | 3,807 | 3,808 | 0 | 5,200 | 5,200 | |
| VNR-O&M | 0 | 5,716 | 5,716 | 0 | 5,119 | 5,119 | |
| TOTAL* | 2,570 | 14,579 | 17,150 | 2,851 | 16,062 | 18,912 | |
| 2009-10 | 2010-11 | ||||||
| Marine | Ice | Total | Marine | Ice | Met- areas |
Total | |
| FTEs | 32 | 108 | 140 | 32 | 104 | 7 | 144 |
| Salary | 2,856 | 3,037 | 5,893 | 3,093 | 2,588 | 656 | 6,336 |
| O&M | 124 | 1,514 | 1,638 | 114 | 1,869 | 235 | 2,218 |
| Capital | 0 | 116 | 116 | 0 | 355 | 177 | 532 |
| VNR-Salary | 5 | 5,588 | 5,594 | 0 | 5,261 | 0 | 5,261 |
| VNR-O&M | 0 | 5,116 | 5,116 | 2 | 4,138 | 2 | 4,142 |
| TOTAL* | 2,985 | 15,372 | 18,357 | 3,209 | 14,212 | 1,069 | 18,491 |
* Numbers are shown in $000s (except FTEs).
Of note, approximately two thirds of the budget for ice services comprises VNR funding, which primarily represents fees for services to CCG. Although the partnership with CCG brings many benefits, this reliance does present an ongoing risk to the SMT SA, as its ability to deliver on mandated services is highly dependent on this continued funding. Furthermore, it poses a further challenge for long-term expenditure planning, as SA program management must ensure flexibility to adapt to possible changes in funding levels due to CCG budget variations. Additionally, the SMT SA, and especially the marine weather component, is reliant on the MSC’s Weather, Observations, Forecasts and Warnings SA (PAA element 2.1.1), as work conducted by meteorologists and other MSC specialists to support services to marine transportation is built upon the “core” services resourced under this SA. The SMT SA could not perform its work at current resource levels without leveraging the work done by this other SA.
Also of note, although FTEs did increase moderately in 2010‑11 with the introduction of the new METAREAs component of the program (additional 4 FTEs, representing less than a 3% increase), it did not come with an overall budget increase for the PAA element. Rather, expenditures for the Ice Research and Ice Warnings and Forecast Information components of the program were reduced by essentially the same amount as the funding now identified for the METAREAs Initiative. Given that the METAREAs Initiative is in early implementation, it is too early to assess its impact on the achievement of results.
As demonstrated by the numbers in Table 11, and portrayed in Table 12, the SA had an increase in expenditures of approximately 10% between fiscal years 2007‑08 and 2008‑09, for both the marine and ice components of the SA. For the remaining two years of the study period, expenditures for the SA remained relatively stable year over year, although there was a slight fluctuation between the two components.
| 2008‑09 vs. 2007‑08 | 2009‑10 vs. 2008‑09 | 2010‑11 vs. 2009‑10 |
|||||||
|---|---|---|---|---|---|---|---|---|---|
| Marine | Ice | Total | Marine | Ice | Total | Marine | Ice** | Total | |
| Year over year changes in spending | 11% | 10% | 10% | 5% | -4% | -3% | 8% | -1% | 1% |
** Includes Ice Research, Ice Warnings, Forecasts & Information and METAREAs.
Table 13 indicates the percentage distribution of resources across the three branches that receive financial resources under the SMT SA. There has been little change in the distribution of financial resources, either to the program components or across the three branches, since 2007‑08. There were no comments from key informants suggesting that this distribution was likely to change, barring concerns regarding a loss of support from the key partner, i.e., the CCG. The low degree of variation across the four years appears to suggest that there does not appear to be a need to adjust the SMT SA’s overall operational approach.
| 2007-08 | 2008-09 | 2009-10 | 2010-11 | |||||||||
|---|---|---|---|---|---|---|---|---|---|---|---|---|
| MSC | S&T | CIOB | MSC | S&T | CIOB | MSC | S&T | CIOB | MSC | S&T | CIOB | |
| Marine | 15% | 0% | 0% | 15% | 0% | 0% | 16% | 0% | 0% | 17% | 0% | 0% |
| Ice | 69% | 1% | 15% | 69% | 1% | 16% | 68% | 1% | 15% | 66% | 1% | 16% |
| % of Yearly Total | 84% | 1% | 15% | 84% | 1% | 16% | 84% | 1% | 15% | 84% | 1% | 16% |
Though generally positive, there were a variety of responses regarding the extent to which the SMT SA governance and priority‑setting mechanisms were supporting the effective management of resources. Since June 2010, the main governance mechanism for the SA has been the Marine Weather and Ice Program Management Board. About one quarter of the key informants were positive in their appraisal of the SMT SA’s governance and priority-setting structure, noting that the new board has been effective in setting priorities, such as approaches to issuing marine forecasts and watches. The remaining key informants indicated that the newness of the board limited the extent to which it was either willing or able to comment on its functioning, although there was a general sense of optimism that the new board structure would be effective in managing SMT SA programs and services.
EC key informants were also asked to comment on the extent to which the two SMT SA components (weather and ice) could share resources and expertise in order to minimize costs and increase effectiveness. It was generally noted that the training required for a weather meteorologist is significantly different than for an ice specialist and, aside from co-locating the two functions, other efficiencies, such as sharing or transferring staff from one area to another, would be impractical.
Several key informants noted, however, that there is some duplication in terms of weather analysis as it relates to wind forecasts. Ice specialists use wind speed direction to track ice flow direction and, as the CIS uses remote sensing to track ice and wind, there are opportunities for both the weather and ice components to share these data. Others also noted that there is room for more integration, as there are natural reasons why ice and marine weather information should be more intertwined (for example, ice changes shoreline impacts and storm surges). Further, end-users do not separate the two functions, so opportunities may exist for additional coordination of information dissemination, warnings, websites, modelling and electronic charting.
It was noted, however, that there are expectations that the METAREAs Initiative will contribute to finding efficiencies in terms of how the marine forecast and ice components work together, and to finding opportunities to work with EC’s S&T community toward developing further services unique to northern communities. Given the early implementation of this initiative, however, it was not possible to discuss examples of how the initiative has yielded these efficiencies.
The clarity of roles and responsibilities among federal government stakeholders involved in the delivery of services to marine transportation was assessed. Key informants generally pointed to a clear articulation of roles and responsibilities. Several respondents noted, however, that there is room for improvement in this area, specifically the need for clarity regarding the formality of shared responsibilities and costs between EC and its collaborators. The federal government’s ice services program is delivered through a formal MOU between EC (specifically the MSC) and DFO (specifically the CCG),85 which generally helps define roles. It was noted by EC and DFO respondents that the CIS relationship with the CCG is generally working very well: both parties understand what each is expected to deliver, due to the existing 5‑year MOU between the two parties.
However, key informants noted that there were still too many informal arrangements in place between SMT and its collaborators, and identified a lack of clarity in some areas, particularly for the marine weather component where the definition of roles and relationships is much more informal. The most frequently identified areas in need of increased clarity were regarding responsibilities for deployment and maintenance of weather buoys and storm surge warnings:
Another area where clarity could be improved, to ensure that program costs are minimized, is contingency plans for emergency situations (for example, oil spills); these plans are not as clear as many (including external stakeholders) would like. Given the potential costs associated with a lack of clarity over emergencies, there were calls to have roles clearly laid out between all key players (e.g., EC, DFO, TC and DND) when an incident occurs in Canadian waters. A need was also identified for better clarity over responsibilities in the Arctic, particularly as the costs associated with working in the North are higher than in southern Canada. A noted example was the need to find the most cost-effective solutions for deploying weather buoys and maintaining a minimum level of verification through observations, although, again, it was identified that the METAREAs Initiative will likely address this.
| Evaluation Issue: Performance | Indicator(s) | Methods | Rating |
|---|---|---|---|
7. Is the Services to Marine Transportation Program undertaking activities and delivering products in the most efficient manner?
|
|
|
Achieved |
The evidence suggests that the program is generally delivering its services in an appropriate and efficient manner and has taken steps to improve efficiency. There may be opportunities for further efficiencies associated with new technologies for dissemination, although this must be carefully managed so that mariners who rely on older technologies continue to receive the information they require for safe and efficient operation.
Generally, key informants expressed a positive view regarding the efficiency of the SMT SA, and noted several examples:
Key informants also identified several areas that can potentially improve efficiency:
Key informants did offer several alternative approaches, however, to improve efficiency and maximize the use of current resources. The majority of alternatives were based on expansion or better use of technology, which is perhaps not surprising given the cost savings and improved efficiency for SMT SA services based on the increased use of technological innovations such as satellite-based data.
Approximately one quarter of the key informants indicated that the SMT SA should explore the better use of technology for dissemination, such as applications for smart phones or alerts via text messages to cellphones. Though there will be technical challenges to making use of enhanced dissemination products, key informants indicated that there is a need to look at the availability and feasibility of new technologies and that both SMT SA components need to take better advantage of technological advances and innovations. However, as was noted above, given the wide range of end-users, many mariners still use and are attached to older sources of technology, making it difficult and potentially harmful for the SMT SA to replace one dissemination tool with another.
As a final source of evidence related to the efficiency of SMT SA products and services, the evaluation team examined an external benchmarking study of the meteorological service organizations in seven countries, including Canada’s MSC. Although the study is not specific to marine and ice information, it contained an international cost comparison for the provision of meteorological services among the organizations shown in Figure 3.89 The figure shows relative spending, not only in terms of the cost per capita, but also the cost per square kilometre.
Figure 3: Relative Spending on Meteorological Services90 (text description)
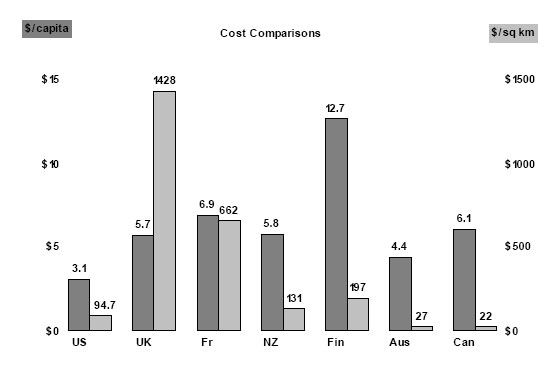
The United States and Finland are of particular interest to the SMT evaluation, as those countries’ meteorological service organizations also have ice services. Regarding Finland, its Finnish Meteorological Institute (FMI) experienced budget increases from 2007‑2009, mainly due to increases in external funding and extra government revenue to increase services to the marine sector and research for the public good. The FMI provides many of the same services to marine transportation as EC’s MSC, including providing forecasting models to its coast guard, among other clients.91 Further, the FMI website contains information on marine weather and the Baltic Sea, including weather forecasts for shipping, sea level, ice conditions, wave forecasts, and sea temperature forecasts.92
Figure 3 indicates that Canada spends approximately twice as much per person as does the United States and approximately half as much as does Finland. In terms of spending per square km, Canada spends less than both the United States and Finland.
38. In 2008, EC obtained certification for its weather and environmental services function under ISO 9001 following implementation of its QMS.
39. EC. 2010. 2010-2011 Performance Measurement Framework Weather and Environmental Services.
40. EC and DFO. 2005. IISPA. EC. CIS Monthly Performance Measurement Reports, July 2007 to August 2010.
41. EC. 2008. Weather and Environmental Services QMS Manual.
42. EC. 2010. Meteorological Service of Canada: Marine Forecast Verification Project – Project Charter.
43. A draft PMF was under development during the evaluation and was shared with EC evaluation team members.
44. EC. 2010-11. Performance Measurement Framework – Weather and Environmental Services.
45. The 2010-11 draft PMF outlined the following outputs and outcomes: percentage of ice charts and forecasts transmitted within 30 minutes of prescribed deadlines; lead times of marine gale warnings of 24 hours or greater, in 80% of events; and level of satisfaction of the marine communities with respect to weather, wave and ice information received by EC. Other outputs and outcomes were developed from PAA element descriptions, evaluation scoping interviews, and consultation with the Departmental Evaluation Committee.
46. EC. CIS Monthly Performance Measurement Reports, July 2007 to August 2010.
47. Earlier wording in reports: “the number of duty days delivered versus requested,” which is consistent with wording in IISPA: “# duty days delivered vs. requested (%).”
48. EC. CIS Monthly Performance Measurement Reports, July 2007 to August 2010.
49. EC. Public and Marine Warning Performance Report, Jan.-Mar. 2010 and Oct.-Dec. 2009.
50. Defined as the number of correct warnings as a percentage of the total number of events.
51. Defined as the percentage of warnings that are incorrect.
52. EC. Maritimes Verification and Newfoundland Verification, 2007-2010.
53. EC. 2004. Marine Weather Services National Survey. Final Report.
54. Recreational mariners represent a minority of the total mariner population and are not the primary focus of the SMT mandate.
55. DFO. 2009. Icebreaking Program Report on Performance: Winter Operations 2008-2009.
56. EC. 2011. Weatheroffice website statistics.
57. Transportation Safety Board. 2011. “Marine Statistics.”
58. DFO. 2009. Icebreaking Program Report on Performance: Winter Operations 2008-2009.
59. EC. 2004. Marine Weather Services National Survey. Final Report.
60. DFO. 2008. Levels of Service Review: Summary of Client Comments. Draft Report.
61 EC. 2010. Canadian Marine Advisory Council Maritimes Region Marine Day.
62. EC. 2011. North Atlantic Fish & Workboat Show 2010 November 26-27, 2010.
63. DFO. April 2011. Evaluation of the Icebreaking Service.
64. EC. CIS Monthly Performance Measurement Reports, July 2007 to August 2010.
65. EC. CIS Monthly Performance Measurement Reports, July 2007 to August 2010.
66. EC. 2004. Marine Weather Services National Survey. Final Report.
67 EC. Public and Marine Warning Performance Report, Jan.-Mar. 2010 and Oct.-Dec. 2009.
68. EC. CIS Monthly Performance Measurement Reports, July 2007 to August 2010.
69. EC. CIS Monthly Performance Measurement Reports, July 2007 to Aug 2010.
70. EC. 2010. Marine and Ice Program Management Minutes Sept. 24 2010.
71. EC. Public and Marine Warning Performance Report, Jan.-Mar. 2010 and Oct.-Dec. 2009.
72. EC. Public and Marine Warning Performance Report, Jan.-Mar. 2010 and Oct.-Dec. 2009.
73. EC. 2004. Marine Weather Services National Survey. Final Report.
74. EC. 2011. Weatheroffice website statistics.
75. EC. 2004. Marine Weather Services National Survey. Final Report.
76. EC. 2010. Canadian Marine Advisory Council Maritimes Region Marine Day.
77. EC. 2010. Canadian Marine Advisory Council Maritimes Region Marine Day.
78. EC. 2011. North Atlantic Fish & Workboat Show 2010 November 26-27, 2010.
79. EC. 2011. North Atlantic Fish & Workboat Show 2010 November 26-27, 2010.
80. Includes one report where data were provided by the U.S. Coast Guard.
81. As noted in the description, unexpected strong winds contributed to the single maritime accident in which weather information was deemed to be inaccurate.
82. DFO. 2009. Icebreaking Program Report on Performance: Winter Operations 2008-2009.
83. The figures shown as “Marine” represent all line items that map to Marine Weather Warnings Forecasts and Information in the departmental financial coding system, and the figures shown as “Ice” represent the values for both Ice Research and for Ice Warnings, Forecasts and Information.
84. Source: Financial Management Branch, EC. May 2011.
85. EC and DFO. 2005. IISPA.
87. EC. 2011. Evaluation of Support of Weather Prediction.
88. EC. 2011. Evaluation of Support of Weather Prediction.
89. Kerry A., Wilkinson C., van Mossel J. June 4, 2009. Benchmarking Study on Business Models for the MSC. Final Report. p. 21.
90. Ibid., p. 21. Note: amounts are presented in U.S. dollars.
91. Ibid., p. 9.
92. Wind and pressure forecast for Baltic Sea