
The findings of this evaluation are presented below by evaluation issue (relevance, success, cost effectiveness, design and delivery) and by the related evaluation questions as presented in Annex 1. The findings at the overall issue level are presented first, followed by the findings for each evaluation question.
A rating is also provided for each evaluation question. The ratings are based on a judgment of whether the findings indicate that:
A summary of ratings for the evaluation issues and questions is presented in Annex 5.
The relevance of the EcoAction program is measured through the following evaluation questions:
Evaluation Issue 1: Relevance
Overall Findings:
EcoAction is relevant in that it is aligned with federal priorities, it provides a public good and there is a continued need for the program. The program is aligned with federal priorities through its emphasis on funding projects that are expected to have direct outcomes on air pollution and GHG emission reduction in addition to habitat conservation, education and capacity building. EcoAction provides a public good by encouraging and contributing to community action that will benefit the environment and the lives of Canadians. Findings also indicate that the program addresses a financial need for these community-based groups: roughly three-quarters of funded applicants report that their project would not have been carried out or would have been carried out with a significantly reduced size or scope in the absence of EcoAction funding.
Evaluation Issue: Relevance |
Indicator(s) |
Methods |
Rating |
1. Is there a legitimate and necessary role for government in this program area or activity? |
|
|
Achieved |
a) Alignment with Federal Priorities
According to documents reviewed for this evaluation, Environment Canada’s participation in environmental protection and restoration is aligned with federal priorities. The Government of Canada articulated its commitment to reducing Canada’s total GHG emissions by 20% by 2020 in the 2007 Speech from the Throne and again in the 2008 Speech from the Throne. Environment Canada’s EcoAction program is aligned with this federal priority through its emphasis on funding projects that are expected to have direct outcomes for air pollution and green house gas emission reduction. Other expected outcomes of EcoAction include habitat conservation, education and capacity building.
Rather than focusing on a single priority environmental issue, EcoAction takes a horizontal approach by allowing communities to identify local priority issues and to act on these priorities in order to create healthier, more sustainable communities. This horizontal approach provides flexibility to adapt to changing federal and departmental priorities while still supporting longer-term priorities in a consistent manner. For example, the EcoAction program was realigned to support the OTC component of the Climate Change Plan for Canada until OTC was sunset in 2006, demonstrating its timely connections to major Government of Canada priorities.
b) Demonstration of a Public Good
Environment Canada is responsible for the implementation of the federal government’s environmental agenda through its mandate to, among others, preserve and enhance the quality of the natural environment, conserve Canada’s renewable resources, and conserve and protect Canada’s water resources. The EcoAction program is aligned most closely with the departmental mandate to preserve and enhance the quality of the natural environment through its funding initiatives for community-level projects. According to program documents, EcoAction encourages projects that protect, rehabilitate or enhance the natural environment, and build the capacity of communities to sustain these activities into the future. Results from the 2002 survey of funded applicants indicate that the main purpose of the most recently completed project among the majority of respondents was education on environmental issues. This was followed by enabling the community to address an environmental issue, habitat recreation/restoration/rehabilitation, energy/GHG reduction and improving water quality. In this way, the program provides a public good by encouraging and contributing to community action that will benefit the environment and the lives of Canadians.
c) Involvement at the Federal Level
EcoAction’s citizen-centred focus on community-level projects and its requirements for matched funds from other sources, including other levels of government, the private sector, foundations, non-profit organizations and volunteers, ensure that community partnerships are created and encourage the sustainability of its projects. This community-level perspective alone, however, would limit the impact of projects to local regions without the more coordinated efforts for broader-reaching environmental outcomes that are possible with involvement at the federal level. The national coordination function at the federal level, combined with its regional network of program offices across Canada, therefore, allows national program priorities to be adapted to support regional ones, as well as providing service that is relevant, effective and client-based. According to program documentation, the EcoAction program is well-known within the non-profit sector and has long been an important Government of Canada presence in support of environmental action at the community level.
Interviewees agree that there is a continued need for the federal government to support community-based projects that have positive results for the environment. Among the reasons provided by interview participants were that community-based projects provide a balance to regulatory and enforcement activities, that federal funding helps groups leverage further funding, that community-based projects help raise awareness of environmental issues and increase community capacity, and that similar projects may not be undertaken otherwise. The program’s grassroots approach and citizen focus were also mentioned.
Furthermore, survey findings suggest that there is a need for the federal government to support community-based projects that have positive results for the environment. Respondents from the 2008 client survey and non-funded applicant survey were asked about the expected or actual situation of their project in the absence of EcoAction funding. Those clients who had received funding answered hypothetically (i.e., “what would have happened in the absence of EcoAction funding”) while those who had not received funding stated what actually took place (i.e., “what happened in the absence of EcoAction funding”). A vast majority would have reduced the size or scope of their project or would have not been able to carry out their project at all based only on the funding received from sources other than this federal program. Their responses are shown in Figure 4-1.
Given that little information is known about applicants, these findings should be interpreted with caution. For example, non-funded applicants, while eligible, may be less experienced or have fewer resources to carry out projects without EcoAction funding. As well, funded applicants were asked to provide opinions on what would have happened in the absence of EcoAction funding, anticipating hypothetical situations that could depend on multiple unforeseen factors. These findings, however, do show some consistency across the two groups on the important role that EcoAction appears to play in the status of the project.
Figure 4-1: Survey Response to “In the Absence of EcoAction Funding, the Project would be/was…”
Survey findings provide evidence of the incremental impact of the EcoAction program. Results indicate that 70% of non-funded projects and 86% of funded projects would not have been carried out or would have been carried out with a significantly reduced size or scope in the absence of EcoAction funding. This demonstrates the benefits of receiving EcoAction funding in terms of maintaining the size and scope of projects and the ability to complete projects.
In comparison, approximately two out of every ten non-funded projects were carried out regardless of EcoAction funding or were carried out with a slightly reduced size or scope, suggesting that the presence or absence of EcoAction funding had little to no influence on these projects being carried out. About another 7% of projects are expected to be carried out at a later date.
Evaluation Issue: Relevance |
Indicator(s) |
Methods |
Rating |
2. Is the program connected with societal/environmental needs? To what extent is EcoAction addressing those needs? |
|
|
Achieved but analysis is based largely on self-reported information |
a) Utility and Rationale of the EcoAction Program
The response to EcoAction funding competitions suggests that there is a need for and an interest in the program. Each year, the program receives about 400 applications for funding and roughly 40% of these are approved (Table 4-2). This is consistent with past program activities, as reported in the 2002 Performance Report for the EcoAction Community Funding Program. While demand for the program decreased in 2007, it is too soon to tell if this is a trend.
2004 |
2005 |
2006 |
2007 |
20081 |
|
Approved Applications2 |
191 (42.8%) |
197 (44.8%) |
152 (32.0%) |
132 (39.6%) |
78 (42.3%) |
Total Applications |
446 |
440 |
475 |
333 |
184 |
1 Partial year reporting
2 Percentage of total applications reported in parentheses.
Source: MIS data (Fiscal Year and Final Decision)
Applications were not evenly distributed across the priority areas of Clean Air (3%), Clean Water (22%), Climate Change (39%) and Nature (35%). However, the alignment of the program with the OTC8 and local priorities (e.g., Clean Water projects tend to be in the Atlantic and Quebec regions) would have affected the distribution of projects.
In addition, interview participants, funded applicants and non-funded applicants point to a strong connection with societal and environmental needs:
Given its community focus, these findings suggest that the EcoAction program and the projects it funds are aligned with the societal and environmental needs of the communities in which projects take place.
b) Gap in Funding for Smaller Groups or Projects
Findings from this evaluation suggest that EcoAction fills the gap for some smaller community organizations which may not otherwise have had the resources to carry out their projects. According to interviews with program staff and program documentation, the EcoAction program is designed to fund small community groups and/or small projects. This is supported by budget information for projects funded through the program. On average, approved projects were of smaller total estimated value (average value of $114,481) and requested smaller EcoAction contributions (average request of $36,625) than projects that were not approved (average value and request of $154,617 and $45,203 respectively). Client surveys also show that EcoAction helped them to leverage additional funding for their projects. This is substantiated by key informant interviews that reveal the program gave credibility to projects, allowing applicants to leverage funding or in-kind support as a result of being able to demonstrate federal government support. These results suggest that smaller groups or projects that may otherwise have less access to resources benefit from funding provided through EcoAction. Some staff felt this to be an important component of the program, emphasizing the need to support smaller community groups that may find it increasingly difficult to compete for funding against larger groups with more resources.
4.1.3 Summary: Relevance
EcoAction supports community-level, environmental projects that reflect Environment Canada priorities, such as the reduction of GHG emissions, improvements in air and water quality and protecting species and their habitat. Those involved in the program or projects report that it funds a variety of projects that would not have taken place in the absence of EcoAction. Some of the evaluation’s key findings include:
The success of the EcoAction program is measured through the following evaluation questions:
Each of these questions is answered in the next two sub-sections.
Evaluation Issue 2: Success
Overall Findings:
Findings indicate that the program was successful in reaching its intended target audiences. The achievement of outcomes, however, was more difficult to determine due to problems with obtaining accurate and complete performance information. The data available in the Management Information System (MIS), the primary repository of information on funded projects, were not updated regularly and data were missing. This impeded the ability to determine whether or not the program’s intended outcomes were achieved. Key informant interviews and client surveys from 2002 and 2008 provided some insights into the achievement of these outcomes but they provided only self-reported information and were not validated by the program. These limitations to the available data made it difficult to understand the full performance story and to determine the success of the program.
Evaluation Issue: Success |
Indicator(s) |
Methods |
Rating |
3. To what extent is the EcoAction Program reaching its intended target audiences? |
|
|
Achieved |
a) Targets of EcoAction and Connections to Environmental Objectives
The program targets non-profit organizations. A number of activities were identified by program staff who were asked about the methods used to inform community groups about the EcoAction program:
Overall, interview participants feel the methods are working well, as evidenced by the high number of applications submitted per year (about 400 applications annually). Given the environmental focus of the program and of the funded projects, it is not surprising that the majority of applications (and majority of approved projects) are led by environmental groups (84% of applications). Non-environmental NGOs account for 10% of applications. Aboriginal, multicultural, seniors, women’s and youth groups account for the remainder (6% of applications).
The program’s weakness in reaching some groups and communities was acknowledged in the Review of EcoAction 2000 prepared by the Review Branch (now called the Audit and Evaluation Branch) of Environment Canada. At that time, the program was making changes to the Applicant Guide and Recipient Handbook in order to reach out to Aboriginal and rural communities. By comparing the distribution of funded projects by recipient organization reported in the 2002 Performance Report to the one obtained with MIS data in this evaluation, there does not, however, appear to have been any major changes in the distribution of applications by group type. During the interviews, one interviewee did state that applications from targeted groups had increased following communication efforts specifically geared toward these groups. This suggests that targeted efforts may be fruitful should the program wish to increase the number of applications from specific groups for specific reasons.
The program pool is a mix of new and previous applicants. Survey data indicate that the majority of funded applicants had previously received EcoAction funding through another successful application (54% in 2008; 53% in 2002).9 For their part, 38% of non-funded applicants were first-time applicants who had never before received EcoAction funding. Non-funded applicants were asked if they had re-applied or intended to re-apply for EcoAction funding: 43% said yes, 33% said no and 24% did not know.
All unsuccessful applicants receive a letter detailing why their application was not approved for funding. Non-funded applicants who participated in the survey were asked if they received an explanation as to why their project was not funded. About half said that they had (54%). The remaining respondents had not (23%) or did not know (23%). Those who indicated that they had received a letter were asked if they were provided with sufficient information with respect to the reason(s) that their application was not successful. About half (46%) felt that they had, about a third (32%) were neither in agreement or disagreement and the remainder (22%) felt that they had not been provided with sufficient information. While 28% of respondents who received an explanation felt that the decision was fair, 40% felt that it was not.10
Program staff felt that program outreach could be improved through more promotion of success stories through the media, by increasing the amount of time spent promoting the program in the field, and by targeting groups that are not yet familiar with the program. Some staff also raised the issue of providing opportunities for smaller community groups that may find it increasingly difficult to compete for funding against larger groups with more resources. Given the constant and high response to funding competitions, however, further outreach is not warranted unless the goal is to increase the participation of specific groups or communities.
Evaluation Issue: Success |
Indicator(s) |
Methods |
Rating |
4. To what extent has the program progressed towards its intended immediate outcomes as identified in the logic model? What were the barriers to success? 5. To what extent has the program progressed towards the achievement of the intermediate outcomes identified in its logic model? What were the barriers to success? 6. To what extent has the program contributed to its stated ultimate outcomes? What were the barriers to success? |
(Refer to Evaluation Matrix in Annex 1 for full listing of outcomes and indicators.) |
|
Progress made, Attention needed; Findings based largely on self-reported information |
Due to the lack of data available from funded projects, it was difficult to determine whether or not the immediate, intermediate and ultimate outcomes were in fact achieved. For some indicators, the number of funded projects that addressed the specific program outcomes is too small to provide a valid measure of whether the outcome was achieved or not. For example, it is difficult to conclude that there was a reduction in the use of hazardous substances that affect water quality as a result of the EcoAction program given the small number of completed projects with this intended outcome. Part of the problem is that project results were not always recorded in the MIS and/or they are not updated regularly. Athough the MIS data are limited in providing useful information on the achievement of intended outcomes, the other lines of evidence used in this evaluation can provide some insight. These findings must be interpreted with caution, however, because they are largely based on self-reported information.11
The achievement of outcomes was examined under the three objectives of the EcoAction program:
Results relevant to each of these objectives are presented in this section.
a) Building Community Capacity
Projects that have a capacity-building component can receive funding through the EcoAction program. Capacity building is defined in the program’s Operational Guidelines as an increase in knowledge and skills or behavioural changes within a group or community that allow it to do the necessary planning and organizational work that would lead to taking action on environmental issues.
Respondents to the 2008 client survey were asked, in their opinion, to what extent their most recently completed project had an impact in their community. Using a five-point scale, where 1 was ‘strongly disagree’ and five was ‘strongly agree’, most respondents selected a rating of four or five, as shown in Figure 4-3.
Figure 4-3: Impact of Most Recently Completed EcoAction Project on Community
At least eight out of ten funded projects reported that they helped raise community awareness on local environmental issues (85%), helped educate the community on environmental issues (84%), assisted in the sharing of information and knowledge in the community (83%) or helped improve the knowledge and skills within the community to preserve and protect the environment (81%). This indicates that funded applicants believe that their project had positive effects on the community. Moreover, funded applicants who indicated a project value of $75,000 or greater or an EcoAction grant of $25,000 or greater were more likely to report that their project helped create a healthier community and a more sustainable community than those who indicated a smaller project value or that they received a smaller grant.
In addition to helping communities, EcoAction aims to fund projects that are sustainable (i.e., that it will continue once EcoAction funding ends). As most projects would not have been carried out or would have been significantly reduced in the absence of EcoAction funding, a group’s capacity to continue the project once EcoAction funding ends suggests that the group has in fact increased or developed its knowledge and skills. While funding can run out, knowledge and skills are lasting and are typically transferable to different circumstances for the group. In supporting projects that have longevity, the goal is to facilitate longer-term positive environmental outcomes within the community even after EcoAction funding ends.
To that effect, funded applicants were asked whether their most recently completed projects would continue after the EcoAction funding ends. Approximately three-quarters of applicants (77%) said their project will continue. This is similar to the results of the 2002 client survey, in which 81% of respondents said that their project would continue. These results point to the anticipated sustainability of projects that obtained EcoAction funding.
Table 4-4: Sustainability of Projects after EcoAction Funding Ends
The project will continue (77%) |
with… (n = 97) … a reduction in size or scope (60%) … no changes (16%) … an increase in size or scope (25%) |
The project will not continue (23%) |
because… (n = 29) … it could not secure funding (48%) … the objectives were achieved (31%) … of a lack of community support (10%) … of organizational difficulties (7%) … of another reason (3%) |
n = 126 (2008 survey of funded applicants, Q28, 29 and Q30)
This is supported by interviews with applicants who also indicated that the project for which they had received funding had continued since they stopped receiving EcoAction funding. One applicant indicated that they found new funding partners and increased their number of volunteers in order to continue. Another applicant stated that partners had requested that the project continue as its objectives had not been entirely achieved at the time the EcoAction funding ended.
Almost half (48%) of survey respondents whose project would not continue, however, reported that they could not secure funding and 10% reported a lack of community support. It may be that establishing ongoing partnerships (i.e., securing funding and other in-kind support) is a factor in a project continuing or in future projects being undertaken. Figure 4-5 illustrates the perceptions of funded applicants on the extent to which EcoAction funding facilitated continued partnerships with other organizations.
Figure 4-5: Extent to which EcoAction Funding Facilitated Continued Partnerships with Other Organizations
Using a scale ranging from 1 ‘not at all’, through 5 ‘a great deal’, slightly more than half of respondents (55%) selected 4 or 5, suggesting they felt that the funding received was beneficial to this end. Comparatively, 13% of respondents felt EcoAction funding did not facilitate partnerships with other organizations.
Respondents who indicated that the funding received through EcoAction facilitated continued partnerships to at least some extent were asked about the nature of these partnerships. Respondents could select as many responses as needed and thus the sum of their responses exceeds 100%:
There were no differences among respondents who indicated their project would continue compared to those who indicated their project would not continue once EcoAction funding ends (aside from undertaking subsequent or ‘next phase’ activities). As such, regardless of whether a project continues or ends, respondents believed that the project will have a continued effect among community partners. This suggests that, even if the project itself ends, the relationships and support generated during the project continue.
Moreover, completed projects had an impact beyond partners, as shown in the MIS. Completed projects reported on the extent to which some of their goals have been achieved. Analysis of social and economic indicators was completed using the MIS data for which at least 25 of the 486 completed projects reported results. This analysis showed that, in their final reports, project coordinators estimated that:12
Projects that had a value of $75,000 or greater involved more volunteers and produced more media reports than projects of smaller value (283 vs. 80 volunteers on average; 17 vs. 5 media reports on average).
Overall, survey results suggest that these funded projects had positive impacts on communities and approximately three-quarters of projects funded through EcoAction are expected to be sustainable. Community partnerships appear to be a key factor in facilitating their longevity and the program played a part in helping to establish these partnerships for more than half of funded applicants surveyed. However, there is little evidence to demonstrate project outcomes after EcoAction funding ends. Given the reported sustainability of these projects, the program is missing a key component of its performance story about the longer-term environmental benefits that EcoAction may be providing for Canadians.
b) Leveraging Support for Environmental Activities
The program design requires that applicants obtain a minimum of 50% of the total value of their project in cash or in-kind support from sponsors other than the federal government in order to be eligible for funding. These eligibility criteria ensure that projects leverage support in the communities in which they take place.
The extent to which partnerships were developed was described in the final reports of a number of completed projects. While these partnerships are not described in detail in final reports, reviewing the extent to which completed projects reported partnerships can provide some insight into how much support was leveraged through partnerships. Information on these partnerships was supported by data recorded in the MIS. Analysis of MIS data shows that between 130 and 160 completed projects had set a goal of developing partnerships for leveraged funds and other support. Projects that had a value of $75,000 or greater developed more partnerships than projects of smaller value (7 vs. 24 partnerships on average). In their final reports,13 project coordinators estimated that:
These analyses of the MIS data suggest that completed projects obtained the support of several organizations each, including governments at the municipal, provincial/territorial and federal levels.
Analysis of survey findings shows that funded and non-funded projects secured a range of partnerships both in terms of types of organizations and types of support received. Participants in the funded applicant survey were asked from which organizations they obtained leveraged funds and in-kind support for their most recently completed project. The most commonly cited groups were individuals and volunteers (70%), municipal governments (61%), provincial and territorial governments (60%), environmental non-governmental organizations (56%) and the private sector (55%). The federal government (excluding Environment Canada) was mentioned by just over a quarter of respondents (28%). Interviewed applicants indicated that they usually call upon partners with whom they have previously worked as well as soliciting new partners either directly or via another partner or through word of mouth.
Funded applicants were also asked to report how each type of organization that assisted with their project did so. As can be expected, the different organizations that assisted with the most recently completed projects did so in different ways. Table 4-6 presents the main ways in which organizations assisted with the project (i.e., selected by 50% or more respondents).
Type of Organization |
Type of Assistance (Selected by ≥ 50%)1 |
Individuals/volunteers (n = 88) |
Provided volunteers or staff (91%) |
Municipal government (n = 77) |
Shared tools or resources (60%) Provided volunteers or staff (55%) Aided with promotion (52%) |
Provincial/territorial government (n = 76) |
Provided funding (71%) |
Environmental non-governmental organizations (n = 70) |
Provided volunteers or staff (63%) Aided with promotion (61%) |
Private sector (n = 67)2 |
Provided volunteers or staff (52%) |
Academic Institutions (n = 49) |
Provided volunteers or staff (71%) |
Other non-governmental organizations (n = 37) |
Aided with promotion (62%) Provided volunteers or staff (54%) |
Federal government (n = 35) |
Provided funding (80%) |
Foundations (n = 35) |
Provided funding (97%) |
Business/industry associations |
Provided volunteers or staff (68%) |
Conservation authority (n = 17) |
Provided volunteers or staff (77%) Provided funding (59%) Shared tools or resources (59%) Provided research or technical advice (53%) |
n = 17 to 88 for Type of Partner (2008 survey of funded applicants, Q9 and Q10)
1 Due to multiple responses, the total percentage of assistance provided for each type of partner is greater than 100%.
2 Two respondents indicated that they partnered with the private sector but did not indicate how it assisted them.
Providing volunteers or staff and providing funding were the most common ways by which partners assisted with projects. Provincial/territorial and federal governments as well as foundations primarily provided funding while the private sector, academic institutions and business/industry associations primarily provided volunteers or staff. Municipal governments and conservation authorities generally assisted projects through a wider range of activities.
EcoAction funding was also perceived as helpful in assisting projects to secure additional funding:
For their part, non-funded applicants whose project was being carried out with or without changes were asked if they had obtained additional support for their project in order to offset the absence of EcoAction funding. It was found that:
The development of partnerships and level of involvement of partners were identified as unexpected positive outcomes of the EcoAction funding by interviewed staff and funded applicants and in project evaluation reports that were reviewed. For example, two of the three interviewed applicants indicated that volunteer participation far exceeded their goal: one group had planned for 250 volunteer-hours but benefited from 1600 volunteer-hours. These applicants also felt that partners were positively surprised by the impacts of the project, which manifested itself in an increased involvement.
Table 4-7 displays the results for all completed projects for which the total contributions reflected the actual project value exactly (148 projects).15 For these projects, it was found that 69% of the total project value was leveraged through cash or in-kind contributions from partners, with the average project leveraging 65% of its value in its community.
Source: MIS data (EcoAction Contribution, Project Status, Partner Cash, Partner Kind)
Although some issues exist around contribution data, funded projects exceeded the 50% minimum level of federal government funding required through cash or in-kind partner contributions.
c) Creating Positive Results for the Environment
The EcoAction program is designed to fund projects that generate positive results for the environment. However, environmental impacts can be difficult to quantify, and not all projects report on measurable results. The EcoAction program has relied on self-report data from projects about their impacts. Funded projects reported that they raised community awareness on local environmental issues and improved the knowledge and skills within the community to preserve and protect the environment, and some funded projects have led to some measurable environmental results, as recorded in the MIS. For those indicators for which results were provided by at least 25 of the 486 completed projects, project coordinators estimated in their final reports16 that:
Moreover, 2008 client survey respondents were asked to what extent they felt that their most recently completed project had a noticeable impact on the environmental and other objectives of their project. Given that each project had different objectives, respondents only provided a response for those objectives they had identified. As such, the number of respondents varies from 13 to 48 applicants.17
Overall, survey respondents agreed that their most recently completed EcoAction project had a noticeable positive impact on the environment, with at least half of respondents selecting a four or a five on a five-point scale for nearly all the areas.
Had a noticeably positive impact on… |
N |
Agree |
|
Disagree |
Don't |
Clean Air / Climate Change |
|||||
Energy/green house gas reduction in my community |
n = 39 |
62% |
23% |
8% |
8% |
Sustainable transportation in my community |
n = 17 |
47% |
35% |
12% |
6% |
Renewable energy in my community |
n = 13 |
54% |
31% |
8% |
8% |
Clean Water |
|||||
Water quality in my community |
n = 35 |
54% |
29% |
6% |
11% |
Water management in my community |
n = 27 |
52% |
26% |
7% |
15% |
Water conservation and efficiency in my community |
n = 24 |
54% |
33% |
0% |
13% |
Nature |
|||||
Habitat creation/restoration/ rehabilitation in my community |
n = 48 |
77% |
19% |
2% |
2% |
Land conservation and land management in my community |
n = 27 |
67% |
19% |
11% |
4% |
Species protection, invasive species reduction in my community |
n = 27 |
63% |
26% |
7% |
4% |
Other |
|||||
The capacity of the community to address environmental issues |
n = 48 |
65% |
27% |
6% |
2% |
Alternative/active habits in my community |
n = 29 |
55% |
21% |
14% |
10% |
Source: 2008 survey of funded applicants, Q25i
Program staff overwhelmingly felt that the EcoAction program was on its way to achieving its ultimate outcomes of creating healthier and more sustainable communities and of motivating individual Canadians to make more responsible environmental decisions, though a number of interviewees cautioned that some gains were modest and that there is still a great deal to be done. Almost all staff felt that Canadians are now much more aware and concerned than they have been in the past about environmental issues, about how their behaviours impact the environment and about their responsibilities toward the environment. Other factors, however, such as an increase in awareness of environmental issues among the general public, may also be contributing to the success of the program.
4.2.3 Barriers to Measuring Intended Outcomes
The limitations in determining the achievement of intended outcomes appear to be more of an issue of performance measurement than actual problems with the success of the program. MIS information was found to be limited during the course of the evaluation because the MIS is not regularly updated and data are missing. The other lines of evidence suggest that the program is on its way to achieving its intended outcomes but these findings are based on self-reported information and require substantiation from project results that should be provided in the MIS. These data issues limit the ability of the program to tell its performance story.
For example, MIS data were used to determine how much funding was leveraged through partners. For the 486 completed projects, the MIS identified cash contributions from 1382 partners, and in-kind contributions from 2452 partners, totalling $34.1M. A large portion of contributions ($10.5M), however, were pledged but not confirmed.18 Since all contributions must be confirmed by EcoAction staff at the time the EcoAction contribution agreement is signed, the presence of unconfirmed contributions indicates that the MIS data are not updated. Consequently, the evaluation team cannot determine if contributions in the MIS were received or if new contributions were received from different partners. As a result, limited analyses were possible. A detailed breakdown around this issue is presented in Annex 6.
In order to determine the extent to which partners contributed to the project value, the evaluation team identified projects in the MIS for which the sum of the EcoAction contribution and leveraged funding (cash and in-kind) totalled the project value.
Actual Project Value = EcoAction Contribution + Leveraged Contribution (Partner Cash + Partner Kind)
Of all 486 completed projects, there were only 148 projects for which the EcoAction contribution and the leveraged funding reflected the actual project value exactly (as presented in Table 4-7). This means that the sum of the EcoAction contribution and the leveraged funding of all other completed projects either exceeded or was smaller than the actual project value listed in the MIS, pointing to problems with the accuracy of the data.
As well, there are some issues with the diversity of the social, economic and environmental indicators to measure project targets and project results. Projects are required to select their target outcomes from a list of 56 indicators at the beginning of their funding. At project completion, they are then required to identify which of the 56 indicators they selected at the beginning were actually achieved. These data are intended to provide an indication of whether or not projects are meeting their intended outcomes.
These measures are limited, however, given the small sample size for each environmental indicator within the survey as well as within the MIS data. Of the 486 completed projects, 268 (55.1%) selected at least one indicator, with 69% of these projects selecting between five and eleven indicators. For 218 (44.8%) completed projects, there were no indicator data although some of these projects had general comments on file regarding results. Moreover, while indicators were selected for some projects, not all projects had results reported in the MIS. In fact, 39 of the 56 indicators had results for 25 projects or less. This means that no single indicator is representative of all EcoAction projects and most indicators reflect one-twentieth of completed projects. This greatly limits the ability to tell the performance story.
4.2.3 Summary: Success
Performance information on projects funded through EcoAction should provide a clear indication of whether or not the intended outcomes of the program have been achieved. However, analysis for this evaluation was limited by the quality of the data available, which is largely self-report, often not quantified in terms of environmental outcomes and not validated. Key findings include:
The program’s cost effectiveness can be assessed through the review of three evaluation questions:
Evaluation Issue 3: Cost Effectiveness
Overall Findings:
EcoAction’s cost effectiveness was difficult to assess because of limitations in identifying program expenditures and measuring program impacts. Consequently, cost effectiveness was examined indirectly by assessing the efficiency of the program. Findings indicate that projects funded through EcoAction provided value for money by leveraging $2.26 on average from community partners for every dollar contributed by the program, exceeding the minimum program requirement. EcoAction has a high administrative costs ratio ($0.39 in salaries and O&M for every G&C dollar), however, as per estimates in its initial design. Program documents suggest that EcoAction’s emphasis on a client-centred, grassroots approach necessitates higher overhead expenses due to the focus on client support. Overall, interviewees felt that EcoAction funds are being used efficiently and effectively as a result of reporting requirements and project evaluation processes currently in place to ensure accountability. Suggestions for improving the cost efficiency of the program included encouraging longer, multi-year projects, streamlining processes for approving applications and considering ways to lower administrative costs.
Ideally, a program’s value for federal dollars spent is assessed through an examination of the costs of the program in comparison to the achievement of program outcomes. These analyses were difficult to complete in this evaluation, however, because of limitations in determining accurate program expenditures and in measuring intended outcomes. EcoAction’s financial data for operating the program and for salaries also included those for other Environment Canada programs like the Environmental Damages Fund (EDF) and the Ecosystems Initiative (refer to Table 2-1 for breakdown of FTEs). As well, data are limited in providing full, detailed performance information on the program (refer to Section 4.2.3 Barriers to Measuring Intended Outcomes for discussion). Therefore, the value for federal dollars spent was examined based on estimates of EcoAction costs provided by program staff and by examining outcomes more generally.
a) Program Costs
EcoAction expenditures were $21.3 million for fiscal years 2004–05 to 2007–08. Of this, $15.3 million were allocated to G&C expenditures. The remainder supported salaries ($4.8 million) and program O&M expenditures ($1.2 million). This means that for every dollar expended in G&C, $0.39 is spent in salaries and O&M (equivalent to 28% of total expenditures). This is very close to estimates as per the initial design of the program.
Program data indicate that 1694 applications were submitted and 672 projects were approved for funding for the same time period, rounds 21 (approved in 2004–05) to round 28 (approved in 2007–08). Some of these approved projects were eventually withdrawn or terminated. As presented in Table 4-9, the average contribution per approved project was $22,762 according to budget data.19 On average, $8,907 was expended on salaries and O&M costs per approved project, which includes all expenses leading to an approved project including proposal review.
Category |
EcoAction Expenditures1 |
Approved Projects (Rounds 21 to 28) |
Average Expenditures per Approved Project |
G&C for projects |
$15,296,214 |
672 |
$22,762 |
Salaries |
$4,801,601 |
672 |
$7,145 |
O&M |
$1,184,321 |
672 |
$1,762 |
Total |
$21,282,136 |
672 |
$31,670 |
1 EcoAction expenditures as determined by program staff.
Source: EcoAction Budget Summary (prepared by program staff) and MIS data (Final Decision)
MIS data were used to determine the average number of applications received and approved from 2004–05 to 2007–08 and program information was used to determine the average full-time equivalents (FTE) for all positions combined (i.e., manager, program officer and administrative staff). As presented in Table 4-10, these analyses indicate that approximately 25 FTEs processed 424 applications and managed 168 approved projects each year. These averages, however, include managers and administrative staff who may not necessarily be responsible for the day-to-day activities associated with managing approved EcoAction projects. Assuming that about 20 FTEs are program officers, each program officer manages an average of 21 applications and 8 approved projects per year. While projects can receive funding for up to two years, the average duration of completed EcoAction projects is one year as identified by the start and end dates listed in the MIS.
Average Number |
Average Applications (Rounds 21 to 28) |
Average Approved Projects (Rounds 21 to 28) | |||
Number |
Per Staff |
Number |
Per Staff |
||
National Average1 |
24.61 |
424 |
17 |
168 |
7 |
Pacific and Yukon Region |
4.00 |
59 |
15 |
21 |
5 |
Prairie and Northern Region |
5.79 |
60 |
10 |
26 |
4 |
Ontario Region |
4.22 |
88 |
21 |
32 |
8 |
Quebec Region |
3.73 |
115 |
31 |
39 |
10 |
Atlantic Region |
5.00 |
102 |
20 |
50 |
10 |
1 National average includes NCU FTEs.
Source: FTEs as per email correspondence with program staff, other data as per MIS data (Final Decision)
These analyses indicate that compared to other G&C programs at Environment Canada, the EcoAction program requires high administrative costs to operate.20 According to program documentation, the EcoAction management model is different compared to most other Environment Canada funding programs in terms of its focus on local community action through the Department’s regional offices. The program’s local presence and proximity to non-profit groups allow EcoAction to understand and fulfil their needs in moving towards real environmental action. This client-centred, grassroots approach requires a focus on providing client support to funding applicants, which necessitates higher overhead expenses compared to other funding programs.
Key informant interviews and program documentation reveal that the services offered by program staff to applicants include activities around outreach to potential funding client groups, monitoring of funded projects, managing the reporting requirements for each approved project and maintaining ongoing communications with partners and stakeholders. During the application process, applicants are encouraged to contact the appropriate regional EcoAction office to discuss the project idea prior to submitting an application. As well, program staff provide applicants with other forms of assistance such as deciphering the eligibility criteria and helping potential clients to develop good proposals. As only a portion of applications are approved, a great deal of energy is expended in assisting applicants who may, in the end, not receive any funding. Minimizing confusion among potential applicants through improved clarity on the tools and forms available for application (see Section 4.4, Design and Delivery for discussion) may alleviate some of the service required by program staff at the front-end of the application process. The extent of the work undertaken by program staff is not within the scope of this evaluation but these analyses suggest that a review of the roles and responsibilities of program staff and areas for improvement may improve the program’s cost efficiency.
b) Project Outcomes
Four hundred and eighty six (486) projects were completed within the time frame examined, including funding round 29 (February 2008). The EcoAction program contributed $13.4 million to these completed projects, which had a total value of $49.1 million.21 Any discrepancies between financial data provided by the program and data for EcoAction funding available in the MIS are likely due to the program not tracking resource data specifically for the EcoAction program as well as potential inconsistencies in entering the data in the MIS.
As presented in Table 4-7, completed projects leveraged an average of 65% of their costs through other partners. In other words, for every dollar contributed by EcoAction, $2.26 was leveraged in the community or through other funding programs. This average exceeds the program’s minimum requirement that 50% of funding be leveraged through cash or in-kind partner contribution.
Funded projects also generated social, economic and environmental results, for which it is difficult to establish a dollar value. However, survey respondents who reported larger project values (i.e., $75,000 or greater) or a larger EcoAction contribution (i.e., $25,000 or greater) were more likely to report positive results in terms of capacity building and developing partnerships than smaller projects or projects that received a smaller EcoAction contribution.
Evaluation Issue: Cost Effectiveness |
Indicator(s) |
Methods |
Rating |
8. Is duplication avoided and complementarity achieved? |
|
|
Achieved but assessment is based largely on self-reported information |
EcoAction is described in its program documents as being unlike other Environment Canada funding programs due to its horizontal approach, which allows communities to identify and address local priorities as opposed to other programs that often focus on a single priority.
While interviewees were aware of other funding programs that support community-based projects, they felt that these programs did not duplicate the EcoAction program. Federal, provincial and municipal government programs were cited as examples, as well as programs led by independent, non-profit organizations and corporations. These included Transport Canada’s Moving on Sustainable Transportation, the Trillium Foundation of Ontario, the Toronto Atmospheric Fund, the Atlantic Salmon Federation, and the Alberta Ecotrust Foundation.
The following characteristics were listed by program staff as aspects that make EcoAction a one-of-a-kind program, in their opinion:
By implementing the requirement for leveraged funding from partners, EcoAction provides a complementary source of financial and in-kind support for community organizations that may require additional resources to carry out their projects. For example, EcoAction covers a variety of expenses, including human resource costs, that may not be allowed according to the funding criteria of the partner organization. Eligible costs allowed by EcoAction differ from community programs and may be used to pay for expenses not covered otherwise.
Current steps toward minimizing duplication are centred on ensuring that EcoAction staff are more knowledgeable about other Environment Canada funding programs. In this way, applicants can be directed to the most appropriate source of funding and departmental programs can provide each other with greater support.
Possible ways to further reduce duplication between EcoAction offices were, as mentioned by program staff, ensuring consistency in funding decisions so that similar projects that may be rejected in one region are not funded in another and ensuring that groups do not apply for funding in multiple regions inappropriately, such as submitting several applications for the same project but in multiple regions.
Evaluation Issue: Cost Effectiveness |
Indicator(s) |
Methods |
Rating |
9. Are there any alternative, more cost-effective ways of achieving the stated outcomes? |
|
|
Progress made, Attention needed |
Overall, interview participants felt that funds are being used efficiently and effectively as a result of the reporting requirements and project evaluation processes that provide accountability. They also felt that EcoAction funds are highly leveraged by environmental groups and that funded organizations were also making excellent use of volunteers. In the interview participants’ opinion, costs to the federal government would be significantly greater if Environment Canada attempted to undertake internally the projects currently being funded through EcoAction.
That said, interviewees made a number of suggestions for improving the cost effectiveness of the program. In their opinion, cost effectiveness could be improved if EcoAction were to:
Although FTE data were estimated by each region for the EcoAction program, there appears to be little relation between the number of FTEs and the number of applications received/approved per region. As shown in Table 4-10 above, the ratio of staff per application ranged considerably from 1:30 in the Québec region to 1:10 in Prairie and Northern region. Although differences may be due in part to potential inaccuracies in reporting estimates for the number of FTEs per region (regions provided an estimate for EcoAction FTEs), the wide differences in these ratios across regions suggest that other factors are at play. Further examination would improve the program’s understanding of the roles and responsibilities of regional staff and any regional differences that may exist.
4.3.4 Summary: Cost Effectiveness
The cost effectiveness of the EcoAction program was difficult to assess because accurate program expenditures (both operating and salary) are difficult to determine and because of limitations in measuring achieved outcomes. As a result, cost effectiveness was examined indirectly by assessing the efficiency of the EcoAction program. Findings indicate that, while the program’s design necessitates high administrative costs, EcoAction is not being delivered as cost efficiently as possible and some improvements may be made.
Although the EcoAction program has been in place for a number of years, the design and delivery of the program were also examined in the course of the evaluation. The following assessments were made:
Evaluation Issue 4: Design and Delivery
Overall Findings:
Target groups for EcoAction report generally that they are satisfied with the program. However, delays in the approval process and the ease of use and understanding of the forms and tools for application were identified as areas for improvement among clients. Program staff report confusion about the decision-making processes within the program, particularly on the role of the NCU. As well, improvements in program monitoring activities, such as improving the accuracy, reliability and completeness of MIS data and reducing the number of indicators for measuring project results, would help to demonstrate program outcomes.
Evaluation Issue: Design and Delivery |
Indicator(s) |
Methods |
Rating |
10. To what extent are various target groups satisfied with the program and the changes to the program? |
|
|
Progress Made, Attention Needed |
EcoAction clients are generally satisfied with the program. When asked overall how satisfied or dissatisfied they are with the program, 64% of survey respondents rated the program on a 5-point scale from 4 ‘satisfied’ or 5 ‘very satisfied’. In the next sub-sections, evaluation findings on satisfaction with the program will be presented as follows:
a) Application Support
The 2002 and 2008 survey data indicate that 75% or more of funded applicants have contacted the EcoAction office to discuss their project idea prior to submitting an application. Similarly, the survey of non-funded applicants shows that 73% of those who did not receive funding also contacted the EcoAction office prior to submitting an application. This means that, with an average of 424 applications made during the scope of this evaluation, an average of approximately 318 contacts were made with EcoAction program officers per year.
Of those who contacted the EcoAction office, approximately half (56% of funded applicants and 50% of non-funded applicants) had done so more than a month before the deadline, regardless of the success of the application. As a result of contacting the EcoAction office, about 80% of applicants were required to modify their application. Non-funded applicants were likely to make more changes to their project than funded applicants (score of 2.71 vs. 2.34 on a 5-point scale, respectively, where 1 denotes no modifications to the application and 5 denotes significant modifications).
Respondents who contacted the EcoAction office were asked to rate on a 5-point scale the helpfulness of the assistance they received when completing the funding application (see Figure 4-11). The results show that a higher percentage of funded applicants report that the services received at the EcoAction office were helpful or very helpful compared to non-funded applicants across all areas of service provided.
Figure 4-11: Level of Helpfulness of Services Received at the EcoAction Office
These differences in responses may be explained by different factors. For one, non-funded applicants may feel that, had they received better services, their application would have been funded or they may be disgruntled over the rejection of their application in general. Therefore, they may be more likely to give a lower rating than funded applicants.
Additionally, data collection for this question differed slightly. The survey of funded applicants was programmed so that respondents only rated services they had identified while non-funded applicants were asked to rate all services, with an option for selecting ‘don’t know / not applicable’ for services they had not received or could not rate. This difference in how the question was programmed in the online surveys was noted after the fact. Non-funded applicants thus had the opportunity to rate any of the services that they could have received while funded applicants had the opportunity to rate only those services that they had previously identified. As a result, the percentages of non-funded applicants who reported that the services were helpful or very helpful may be over-estimated since they could have reported on services they may not have received in the first place. Because these percentages are lower than those for funded applicants across all categories, this further accentuates the difference between funded and non-funded applicants.
b) Application Review
Previously, the EcoAction program used a three-stage selection process that included an administrative review by regional staff, a technical review by experts from Environment Canada, other government departments, and other levels of governments, and a final review conducted by regional Public Advisory Committees (PAC). The program also held two funding rounds per year, with deadlines for submitting proposals in February and in October.
In January 2008, the selection process of the EcoAction program was modified through the dismantlement of the PAC. While the process continues to use a three-stage selection process, the process now includes an administrative review by staff in the region where the proposal was submitted, a technical review by experts from Environment Canada, other government departments, and other levels of government, and a final review by a Review Committee composed of staff from NCU and the regions. Final funding decisions for projects are made by Regional Directors General from the regions where the application was submitted. The program has also moved to one funding round per year. The new deadline for submission of proposals is November 1 of each year.
Although moving the single deadline to November may have administrative benefits, applicants have consistently submitted more proposals in February. Each year, 264 proposals were submitted in February/March on average compared to 140 proposals submitted in October. Similarly, survey respondents indicated a preference for submitting proposals during the fall/winter months (December to February) when asked what month they would prefer to submit a future application (see Figure 4-12), while keeping in mind that the program requires at least three months to make a final decision on an application. Months most commonly preferred were: December (15% of survey respondents), November (14%), January (13%), and October (12%).
Figure 4-12: Preferred Month to Submit Future EcoAction Funding Applications
This is in line with findings from interviews with funded applicants and program staff: most projects are designed to take place during the spring/summer and to wrap up in the fall months. Late fall/winter is therefore a generally preferred time period for developing proposals.
Further, funded applicants were asked to what extent they felt that their application was reviewed in a timely manner, using a 5-point scale. Responses were mixed, with about half (49%) of funded applicants agreeing that the review was timely and about one-third (32%) disagreeing. The survey of non-funded applicants show similar results compared to funded applicants on the timeliness of application review.
Figure 4-13: Extent to which the Application was Reviewed in a Timely Manner

Funded applicants who did not feel their application was reviewed in a timely manner (i.e., gave a rating of ‘3’ or less) were asked to comment on the extent to which delays had a negative impact on the timing of their project. The response scale for this question was based on a 5-point scale, ranging from 1 ‘not at all’ through 5 ‘a great deal’. More than half of respondents (53%) selected ‘4’ or ‘5’, suggesting that delays in reviewing applications had a negative impact on the timing of their projects.
A review of program documents reveals that the application review process experienced some delays over the last few years. According to the EcoAction Workplan 2006–2007, approved projects for February 2006 funding were announced in July 2006. Similarly, approval for projects received and reviewed in November 2006 occurred in April 2007, with successful applicants being contacted at the beginning of May 2007. This indicates that funding for projects was delayed by five or six months. Some of these delays were the result of factors external to the program, such as the department allocations process. Some interviewees, however, noted that while regions were able to maintain a good turnaround for processing applications, delays occurred at the final stages of the application process.
Delays in the departmental financial approval process were cited by all program staff and other interviewees as a barrier impeding the ability of projects to achieve their objectives. Interviewees felt that funding delays have resulted in groups that are:
c) Application Form and Tools, and Services Received
Survey respondents were asked to rate how easy it was to understand EcoAction forms and tools. Overall, over half of the funded applicants agreed that the eligibility criteria and application guide were easy to understand (67% and 53%, respectively) while less than half of non-funded applicants report that they were easy to understand (46% for both tools). As well, less than 45% of both funded and non-funded applicants report that the application forms were easy to complete and that the EcoAction website was easy to navigate. Of the funded applicants, 39% report that the reporting forms were easy to use. These survey findings suggest that applicants, both funded and non-funded, have some difficulty understanding and using the forms and tools for application to EcoAction funding.
Statement |
Funded |
Non-funded | ||||
Agree |
(3) |
Disagree |
Agree |
(3) |
Disagree |
|
The eligibility criteria were easy to understand |
67% |
23% |
7% |
46% |
27% |
25% |
The application guide was easy to understand |
53% |
27% |
13% |
46% |
31% |
21% |
The application forms were easy to complete |
40% |
36% |
21% |
40% |
29% |
30% |
The reporting forms were easy to use |
39% |
26% |
31% |
n/a |
n/a |
n/a |
The EcoAction website was easy to navigate |
44% |
29% |
13% |
41% |
31% |
16% |
Note: ‘Don’t know /Not Applicable’, which ranged from 1% to 14% of respondents, are not shown in the table.
n =126 (2008 survey of funded applicants, Q22 a, b, d, e, h)
n = 154 (2008 survey of non-funded applicants, QC5a, b, d, e)
Overall, however, interviewed program staff were satisfied with the application form and the support provided to applicants. The application form appears to have recently undergone significant improvements and interviewees felt strongly that program staff provide a high level of support to groups throughout the application process. That said, the most commonly cited suggestion for improvement in this area was the creation of an on-line application form directly linked with the MIS. Further suggestions included providing groups applying for funding with more direction around how to create work plans and communication strategies, as well as providing groups with tools for measuring results in order to increase consistency across applications.
EcoAction applicants who received funding were more impressed by the overall level of service they received from project officers than those who did not receive funding (average of 4.30 compared to 3.18 on a five-point scale). However, this could be due to the fact that funded applicants have developed a relationship with program staff throughout the course of the project and non-funded applicants may be more likely to be dissatisfied with the program altogether. Non-funded applicants may also express greater disappointment if they received support from EcoAction staff when preparing their application, only to have their request declined.
Evaluation Issue: Design and Delivery |
Indicator(s) |
Methods |
Rating |
11. How effective is the governance structure? |
|
|
Progress Made, Attention Needed |
The evaluation focused on determining to what extent staff understood their roles and responsibilities and the overall governance structure of the EcoAction program, and how effective they believed the governance structure to be.
As described in the section on Roles and Responsibilities (Section 2.2), a number of entities are involved in the delivery of the EcoAction program. EcoAction offices in the regions provide a regional presence while the NCU provides management and support in design, planning and reporting to the Minister’s Office. The combination of this strong regional identity with the national component requires a certain level of coordination and cooperation as well as clearly defined roles and responsibilities across the program.
Overall, program staff felt that the program adhered to practices for good management. They felt that the program was:
Most program staff felt that the EcoAction program failed to demonstrate good governance in terms of responsiveness in that program staff were unable to respond to stakeholders and organizations in a reasonable time frame. For example, delays in the approval process for project deliverables by community groups used to be 12 weeks to accommodate the internal procedures involved in moving the application through the system within the Department. These delays are now estimated to be 6 to 8 months.
Program staff who were interviewed also felt that decisions made at the NCU did not always reflect the reality of what is going on in the field. Some expressed concern over decisions made within the NCU and/or the Minister’s office that were contrary to regional office recommendations. Some interviewed program staff were disappointed with what they saw as a shift to national decision making and felt that the regional offices should be able to provide input and advice in the process.
Interviewed staff felt that regional staff roles were clearer than the role of the NCU, particularly since the changes made in 2006 when the program’s structure was moved to a Result Management Structure (RMS). Prior to this shift, the program was managed by a traditional management structure in which the regions were responsible for managing their own regional funding envelope and the NCU provided support through additional capacity, tools and networking. As a consequence of this change to the RMS, approval for EcoAction projects moved from Regional Directors General (RDG) to Outcome Project Groupings (OPG) leads based on recommendations from regional managers and Public Advisory Committees (PAC). The Outcome Project Plan (OPP) lead signed for approval for project funding instead of the appropriate Regional Director. This governance structure has since moved back to the line organization approvals (or traditional structure), returning delegated signing authorities for EcoAction projects to RDGs. Given these shifts in responsibilities and management structure over time, program staff point to a sense of uncertainty around who is responsible for decision making and what the role of the NCU is or should be.
These findings suggest that the assessment of decision-making processes and roles and responsibilities of staff at NCU and in the regions would be beneficial for the program.
Performance monitoring activities are designed to ensure that the program is accountable for its decisions and actions. Both funded applicants and program staff have a responsibility to demonstrate accountability through project and program monitoring. For the EcoAction program, the Management Information System (MIS) is the main repository of centralized information on projects. The MIS, however, does not provide accurate, reliable or complete data because it is not updated regularly and data on projects are missing. This has a serious impact on the program’s ability to demonstrate its performance story as well as to inform decision making.
The following two subsections describe how EcoAction projects and the program itself are monitored.
a) Project Monitoring
Funded applicants are responsible for demonstrating that the funding received is used appropriately. Funded applicants are required to submit quarterly progress and financial reports, to produce a final report that includes a final financial report, a detailed financial summary and a project evaluation document. In addition, projects that receive funding of more than $25,000 are required to submit independently audited financial statements. Program staff may also conduct site visits to ensure that the funds are used appropriately, although the frequency and regularity of these visits vary between regions due to logistics and costs.
Interviewed program staff were asked if these practices were insufficient, sufficient or overly burdensome to successful applicants. In general, those interviewed qualified the practices as sufficient to overly burdensome. Those who felt that the practices were sufficient cited the program’s accountability to the public as the primary reason for the current monitoring level. In addition, these interviewees felt that quarterly monitoring helped ensure that projects stay on track. Similarly, interviewed funded applicants also stated that the requirements were appropriate and important to ensure accountability.
Most interviewees, however, also felt that groups, especially smaller ones, lacked the resources and experience to fulfil the necessary reporting requirements. The most difficult aspect of reporting for groups related to the financial components. EcoAction staff reported that they are spending time helping groups complete these requirements. Auditing requirements were also found to be overly burdensome, especially for smaller projects. Program staff suggested changing the auditing requirement to projects that receive an amount greater than $50,000 as they felt that audit costs (approximated at $6,00024) represent a significant proportion of the money received.
These issues were also raised in the survey of funded applicants. In an open-ended question, funded applicants were asked what, if anything, should be done to improve the program. Of those who responded, 37% mentioned reducing the frequency and complexity of the reporting requirements; 7% reducing the requirement to measure outcomes; and 5% revising or eliminating the auditing process.
Finally, one monitoring issue that was mentioned in the 2000 Review of EcoAction and that does not appear to have been addressed is the lack of information on what happens to projects once EcoAction funding ceases. While the program encourages organizations to build self-sustaining projects, little follow up is undertaken aside from asking applicants if the project would continue. Program staff feel that the program is progressing towards the achievement of its ultimate outcomes but there are limited data available to support these observations. Given the longevity of the EcoAction program, it is in a good position to provide stronger evidence on the longer-term impacts of its funding initiatives.
b) Program Monitoring
Program staff are responsible for demonstrating that the program is being administered appropriately and achieving its intended outcomes. This is primarily achieved though the delivery of the program and the recording of information in the MIS.
Interviewed program staff were asked to describe and comment on the current performance monitoring strategy. Most program staff felt that the measurement strategy adequately addressed program needs. However, concern was raised that more information was gathered than was actually being used. There seemed to be considerably uncertainty around whether much of the data were used at all by program staff. This suggests that there may be a disconnect between those who are responsible for collecting the data and those who use it, and this disconnect may be one of the reasons why there is inconsistency in updating and maintaining the information in the MIS. The lack of understanding on how the information is used may reduce the care with which the same information is maintained. Regardless of the cause, the most accurate source for project information appears to be through contacting the regions as a result of the lack of regularity with which the MIS is updated. This limits the ability of the NCU in accessing program information quickly and efficiently. Furthermore, it affects the extent to which the program can be evaluated in an efficient and accurate manner.
As well, findings indicate that there are a large number of indicators which were selected by projects but for which no results were reported. (Refer to Annex 3 for findings for all indicators.) The MIS collects project goals and outcomes related to up to 56 social, economic and environment indicators, some of which also include sub-indicators. Of the 486 completed projects, 268 (55.1%) selected at least one indicator, with 69% of these projects selecting between five and eleven indicators. For 218 (44.8%) completed projects, there were no indicator data although some of these projects had general comments on file regarding results. This suggests that the number and level of details of the program indicators may not lend themselves well to community groups. Moreover, while indicators were selected for some projects, not all projects had results reported in the MIS. In fact, 39 of the 56 indicators had results for 25 projects or less. This means that no single indicator is representative of all EcoAction projects and that most indicators reflect one-twentieth of completed projects.
Overall, there were five indicators for which there was no missing data, meaning that all those funded applicants who said that they would measure this particular indicator at the outset of the project did in fact report on the indicator at the completion of the project: vehicles tested, tune-ups and emissions clinics, conversion of gardens from chemical to natural techniques, riparian habitat or ecosystem created or restored, and removal of dump sites posing a danger to ecosystems. All but one of these indicators involved counting concrete elements (vehicles, clinics, gardens, sites). Other indicators that measured similar elements (volunteers, partnerships, structures, visits) also had fewer missing results. This means that it is likely easier to assess the outcomes of a project if these outcomes can be easily counted, such as the number of vehicles tested. Other outcomes are more difficult to evaluate, such as those measured by kilograms or litres, unit/100ml of water, or tonnes (e.g., tonnes of reduced GHG emissions).
Another suggestion arising from some of the interviews with informants was to provide groups with tools for assessing project results in order to increase consistency across reporting. This suggests that, in measuring project outcomes for MIS indicators, it is possible that different projects use different strategies or different baselines. For example, a number of projects may have included reducing car idling as an objective. To assess the amount of GHG emissions that was reduced by turning the ignition off, projects need to know, among other elements, the amount of GHG produced by minutes of idling. If different projects use different standards, the overall data are skewed.
Evaluation Issue: |
Indicator(s) |
Methods |
Rating |
13. What are the best practices and lessons learned from this program? |
|
|
N/A |
a) Fundamental Strengths and Weaknesses
Interviewed program staff were asked if there were any fundamental weaknesses in the design or delivery of the program, and what were its strengths.
Interviewees cited the following as strengths of the EcoAction program. The program, in their opinion:
The following were cited as fundamental weaknesses of the EcoAction program by interviewees:
b) Best Practices
Interviewees were invited to share any best practices or lessons learned related to the EcoAction program. The following were mentioned by interviewees:
In a similar fashion, client survey respondents were asked to identify, in addition to funding, the top three services offered by the EcoAction program that are most useful to their organization or project. The results are displayed in Figure 4-15.
Figure 4-15: Most Useful Services Offered by EcoAction to Organizations/Projects
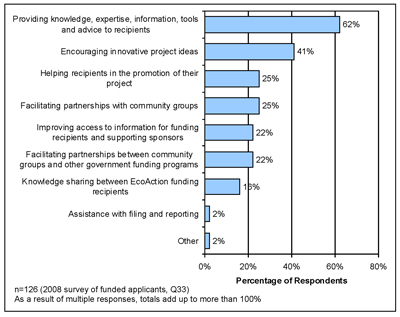
Providing knowledge, expertise, information, tools and advice was selected by 62% of respondents, followed by encouraging innovative project ideas (41%). Other services were selected by one-in-four or fewer respondents. This provides evidence of the usefulness and quality of the services delivered by program staff.
4.4.5 Summary: Design and Delivery
It should be noted that this evaluation was a summative (impact) evaluation and only limited analysis was undertaken with respect to design or delivery issues.
Client Satisfaction with the Program: EcoAction clients were generally satisfied with the program and services received. Areas where applicants were less satisfied included the time taken to review applications and the ease of understanding of various forms and tools. More specifically:
Less than half (49%) of funded applicants agreed while 20% disagreed that their application review was timely. Non-funded applicants reported similar responses to that of funded applicants. These findings point to the existence of delays in the review process for EcoAction applications. Delays in the departmental financial approval process were also identified by program staff and other interviewees as a barrier to the achievement of objectives by funded projects;
Overall, a higher percentage of funded applicants compared to non-funded applicants found program staff to be helpful or very helpful during the application process. For example, 83% of funded applicants report that program staff were helpful or very helpful in determining the eligibility criteria of their projects while 59% of non-funded applicants found them helpful. Similarly, 76% of funded applicants reported that program staff were helpful in completing the application properly compared to 53% of non-funded applicants;
Findings indicate that both funded and non-funded applicants find some of the application forms and tools difficult to understand. A higher percentage of funded applicants found both the eligibility criteria (67%) and the application guide (53%) easy to understand compared to non-funded applicants (46% for both eligibility criteria and application guide). However, less than 45% of both funded and non-funded applicants report that the application forms were easy to complete and that the EcoAction website was easy to navigate.
7 For the year 2008, most recent numbers indicate that there were 254 applications in total, of which 148 were approved. These were not included in the analyses, however, because they were not available when the evaluation was being implemented.
8 The EcoAction program aligned itself in 2003 to increase its support for climate change projects to 50% of its overall funding envelope in support of the One-Tonne Challenge, which was part of the Climate Change Plan for Canada. Funding was allocated in this manner from 2003 to 2005.
9 In the 2008 survey, respondents were asked how many times they had received EcoAction funding since 2004; in the 2002 survey, respondents were asked how many times they had ever received EcoAction funding.
10 This question was added to the survey after about one week of surveying. As such, not every survey participant answered this question.
11 Self-reported information was collected through key informant interviews. As well, survey data and the final reports for EcoAction projects are self-reported and have not been validated by program staff or the evaluation team.
12 These results were not validated.
13 These results were not validated.
14 Federal, provincial/territorial and municipal departments may have been involved in several collaborations and projects.
15 Refer to Section 4.2.3 Barriers to Measuring Intended Outcomes for discussion on limitations of MIS data.
16 These results were not validated.
17 “Equipment replacement in my community” and “Smog reduction in my community” were selected by one and three respondents respectively. Given the small sample size, these were excluded from the table.
18 A “pledged contribution” is an informal promise in which an organization commits to making a financial or non-financial contribution. A “confirmed contribution” is a formal promise in which an organization commits to making a financial or non-financial contribution. A pledged contribution can become formal in, for example, a letter of support EcoAction staff ensure that contributions are confirmed (i.e., that formal promises are in place) prior to the signing of the Contribution Agreement (CA).
19 MIS data indicate that the average contribution per approved project was $27,836. The average calculated using budget data is reported, however, because EcoAction program staff indicated that the budget information was more accurate.
20 For example, Environment Canada’s Invasive Alien Species Partnership Program (IAS) and the Habitat Stewardship Program (HSP) estimate that $0.15 and $0.13, respectively, are spent in salaries and O&M for every dollar expended in G&C based on budgeted data.
21 For 18 completed projects, there are no data in the MIS for ‘actual project value’ (i.e., $0.00). For these 18 cases, the ‘approved project value’ was used instead.
22 A national scoring sheet was developed in 2008 for the proposal review for the November round and will be adapted. This scoring sheet, however, is not used to compare projects between regions.
23 Sections 4.3.1 Program Costs, 4.4.3 Performance Monitoring and 6.0 Recommendations point out ways in which record-keeping for accountability at the program level could be improved.
24 As reported by interview participants.