Previous page | Table of contents | Next page
Data on the level of treatment received by wastewater effluent is collected for the population that is connected to a sanitary sewer system in Canadian municipalities. In 2009, 1524 municipalities accounting for 28.1 million Canadians provided information on the number of people in their jurisdiction who were connected to a sanitary sewer system or who used private septic systems or sewage haulage. Of this population, a large majority (87.1%) is served by a piped sewer network, with 12.4% using private septic systems and 0.5% served sewage haulage.
As the 2009 MWWS only surveyed a sample of municipalities with population below 1000 people, and given that many small municipalities do not have sewer systems at all, it is likely that the total percent of Canadians using private septic systems and sewage haulage is somewhat higher than that reported here.
Of the population connected to sanitary sewer systems, 78.7 % had their wastewater effluent treated at a secondary level or higher. Only 3.2 % received no treatment or preliminary treatment only (screening, grit removal) of their wastewater, while 18.1 % received primary treatment, 6.8 % received secondary treatment in waste stabilization ponds (sewage lagoons), 54.5 % received secondary-mechanical treatment and 17.4% received tertiary-level treatment.
The 2009 results show no significant changes since the 2006 survey cycle. The 2006 data showed 30.8% of the population receiving tertiary or advanced treatment and only 42.4% receiving secondary-mechanical treatment; however, these large differences compared to the 2009 results are due to a change in the way data was collected and classified rather than an actual change in treatment levels. In 2006, all treatment levels involving one or more “advanced” treatment techniques (see Glossary for more detail) were classified as “advanced/tertiary” while in 2009 the survey respondent had to choose between five categories only: none/preliminary, primary, secondary-WSP, secondary-mechanical and tertiary. Therefore, the tertiary category in 2009 contains only tertiary-level wastewater treatment.
Smaller municipalities are the most likely to have a greater percent of their population served by no wastewater treatment or preliminary treatment only. These two categories represent over 9% of the population in communities of 1000 to 2000 people and around 16% of the population in communities of less than 1000 people. Similarly, these small communities have the smallest percent of population served by tertiary-level treatment.
However, even in small municipalities, the majority of the population is served by secondary-level treatment. In communities of under 5000 people, secondary treatment is most often provided by waste stabilization ponds, while in communities of greater than 5000 people, secondary-mechanical treatment is more common.
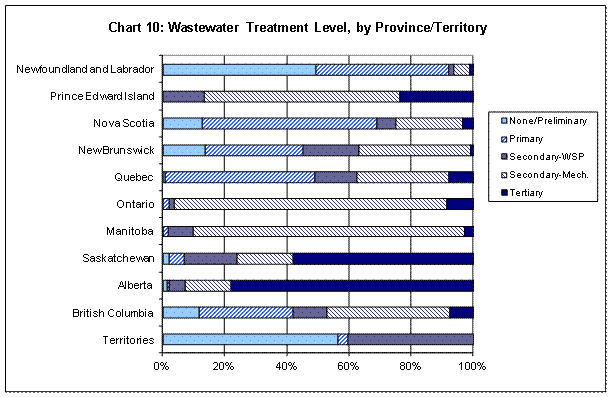
The percent of population served by each level of treatment varies widely between provinces. Newfoundland and Labrador and the three territories have significant proportions of the population that are not served by any wastewater treatment or only by preliminary treatment. Primary treatment is prominent in Newfoundland and Labrador, Nova Scotia, Quebec, and, to a lesser extent, New Brunswick and British Columbia. Ontario and Manitoba’s populations are almost entirely served by secondary-mechanical treatment, while 78% of Alberta’s population is served by tertiary-level wastewater treatment.