Previous page | Table of contents | Next page
The 2009 results show a very similar distribution of water use by sector as previous survey cycles. The residential sector continues to account for the bulk of municipal water use (57.4% in 2009). The commercial/institutional sector (including water use by the municipality) follows with 18.7% of total water use. Leaks and system flushing/maintenance account for 13.3%, and the remaining 10.6% of water is used by industries and agricultural operations that are connected to the municipal water supply.
Leakage and system flushing/maintenance rose very slightly from 12.8% in 2006 to 13.3% in 2009. This small change could be due to any of a number of factors, including more accurate measurement, higher system pressure due to lower water use, or aging infrastructure leading to increased main breaks and leaks.
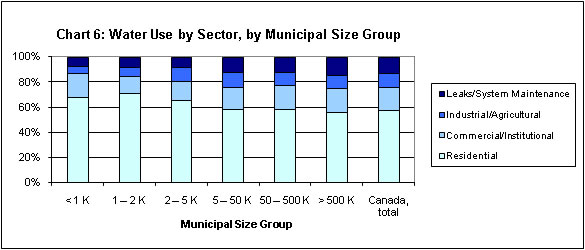
More water is lost through leaks and system maintenance in larger municipalities than in small communities, with the percentage in large cities of over 500 000 people (14.9%) almost twice that of the smallest communities of under 1 000 people (7.6%). Between provinces, the percent of water lost through leaks and system maintenance varies from a low of 7.5% in Newfoundland and Labrador to a high of 22.1% in Quebec. Water losses are related to a number of issues, including the condition of distribution infrastructure and level of pressure maintained in the distribution system.
The proportion of water used by the residential, commercial and industrial sectors also varies considerably by municipality size. Smaller communities tend to have less commercial and industrial water use, and so the residential sector accounts for a greater percent of water use than in larger communities. Residential water use in municipalities of under 2 000 people is around 70%, while this sector only accounts for 56% of water use in municipalities of over 500 000 people.