Previous page | Table of contents | Next page
All MWWS surveys since 1991 have indicated households that have volume-based water rates tend to use significantly less water per person than those on flat rates or taxes. This analysis is based on a comparison of the per capita residential water use between municipalities with 0% residential metering and those with 100% residential metering. The 0% and 100% metering rates are used as a proxy for the use of flat or assessed water rates versus the use of volume-based water rates; it is assumed that metered households are subject to volume-based water charges and households without water meters are subject to flat rates or assessed water taxes.
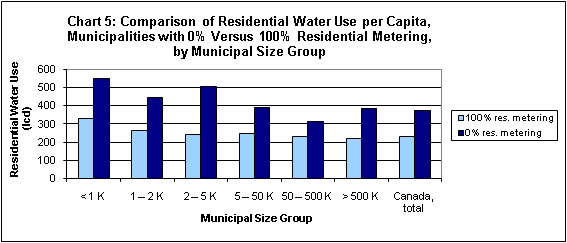
The 2009 survey shows that in municipalities with volume-based water charges (using 100% metering as a proxy), the average residential consumption rate was 229 Lcd. In municipalities without metering and therefore no volume-based pricing, the average residential consumption rate was 65% higher at 376 Lcd. This association between metering and lower per capita water use holds true for all provinces and size groups, although the magnitude of the difference varies.
It is important to note, however, that the difference in water use between metered and unmetered communities cannot be solely explained by the use of water meters or volume-based pricing. While there is strong evidence to suggest that volume-based pricing is associated with lower municipal water use, water use can also be affected by a wide variety of other factors, including location, climate and socio-economic variables.