June 2010
Previous page | Table of Contents | Next page
For 2009-10, planned professional resource requirements to carry out audit engagements, evaluation projects, and strategic planning and coordination were approximately 208 person months (PM) and $540,000. Overall, the Branch has used approximately 184 PM and $378,000. A breakdown of the PM allocation and professional services by function is shown below. These figures do not include resources dedicated to management activities.
| Function | Person Month (PM)* Planned |
Person Month (PM)* Actual |
Professional Services $K Planned |
Professional Services $K Actual |
|---|---|---|---|---|
| Internal audit engagements | 71 | 57 | $144 | $26 |
| External audits | 15.5 | 16.5 | ||
| Evaluation projects | 76 | 67 | $155 | $1315 |
| Strategic planning and coordination | 45 | 43 | $241 | $221 |
| Total | 207.5 | 183.5 | $540 | $378 |
*Person month description by category:
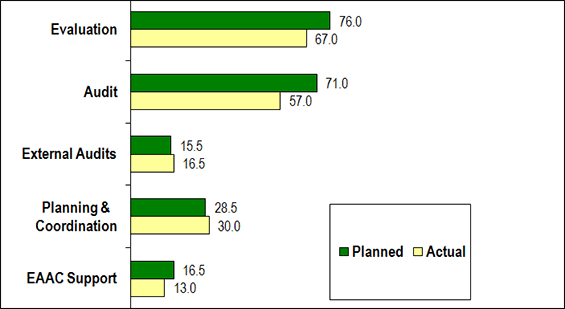
Figure 1 offers a comparison between the numbers of PM planned versus actual PM spent on projects and is based on information extracted from the Branch's TRS.
Figure 1: Project-Related Person Months Utilization by Function

In 2009-10, the IA Division had planned a total of 71 PM to complete its audit projects of which two PM were targeted for recommendations follow-up. The TRS information revealed that approximately 53 PM were applied to audit projects and four PM to recommendations follow-up in 2009-10 with a total variance of 14 PM. The PM utilization was lower than expected. The above reduction of the 14 PM was counterbalanced with more PM than originally planned coded against extended sick leave (five PM), staff departure (three PM), additional training (three PM), TeamMate (one PM), external audit (one PM), and other administrative activities (one PM).
The Evaluation division had originally planned for 76 PM to complete its evaluation projects. Approximately six of those PM were targeted for consultation and advice and two for recommendations follow-up.
In 2009-10, the Evaluation division applied approximately 60 PM towards Evaluation projects, five PM to consultation and advice and two PM to recommendations follow-up, a total variance of nine PM. The PM utilization was lower due to some resources being devoted to strategic review, difficulties associated with staffing short-term replacements for staff on leave or secondment plus the need to spend more resources than anticipated on implementing the new Policy on Evaluation.
The Strategic Planning and Coordination division had planned for 45 PM to complete its projects and used 43 PM. The variance of two PM can be accounted for less time dedicated to EAAC.
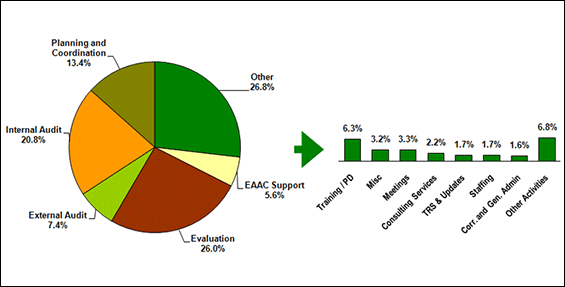
Figure 2 provides the PM spent on various activities and is also based on information extracted from the TRS.
Figure 2: Percentage of Total Person Months Utilization by Function

Overall, 73.2 percent of productive employee time was dedicated to audit (20.8 percent), evaluation (26.0 percent), strategic planning and coordination (13.4 percent), and support provided to EAAC (5.6 percent) during 2009-10. Approximately 26.8 percent was spent on other activities such as training, meetings, consultations, staffing, TRS and a number of administrative activities, miscellaneous and other activities.6
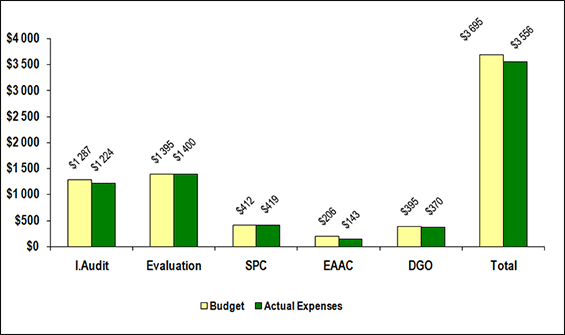
Figure 3 provides a breakdown of Branch expenditures for 2009-10 by function, including those related to management activities.
Figure 3: Actual Expenditures by Function

The total resource requirement for 2009-10 was forecasted to be 3.7 million dollars. The actual budget for the Branch was 3.7 million dollars.
The Branch expenditures for the same year amounted to approximately 3.6 million dollars, leaving a small surplus of 3.8% of budget.
For this report, the AEB is piloting the costing of audit and evaluation projects using salary and professional contracting dollars spent on each project in 2009-10. A detailed report on the total expenditures of each internal audit project for 2009-10 is provided in Appendix E and the total expenditures of each evaluation project for 2009-10 is in Appendix F. Given that this is the first year of this pilot, the information contained in these appendices do not present the full cost of audit and evaluation projects. This is because these appendices do not capture costs incurred in the previous fiscal year for those audits and evaluations that started in the previous fiscal year. Similarly for the 2009-2010 audits and evaluations that will not be completed until the following fiscal year, the appendices do not factor in the costs to be incurred in the following fiscal year. As we continue to collect costing information, we will be better positioned to report complete costs per audit and evaluation projects in future years.
5 This number does not include 305K from TB Submissions for specific evaluation activities.
6 The category Miscellaneous refers to activities such as Networking, Media Review, Support to Professional Groups/Associations) and the category Other Activities refers to Strategic review, Management, Recommendation follow-up and TeamMate/Evaluation Process.